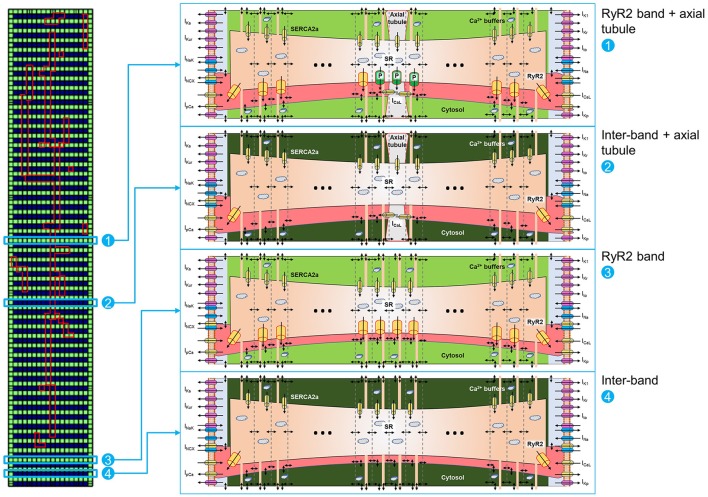
Figure 4.
Schematic representation of 100-segment model. The model is represented by four different locations in the virtual cardiomyocyte. (1) Represents an RyR2 band with axial tubule and hyperphosphorylated RyR2 (indicated with “P” in the scheme) adjacent to the axial tubule, as reported by Brandenburg et al. (2016). (2) Represents an inter-band gap with axial tubule. (3) Represents an RyR2 band without axial tubule. (4) Represents an inter-band gap without axial tubule. Each segment is divided into 18 domains, as depicted in the matrix on the left, but only a subset of domains is shown for clarity. Please note the expression of RyR2 in the first and last domains in the segments located between RyR2 bands [i.e., (2) and (4)].

