Figure 7.
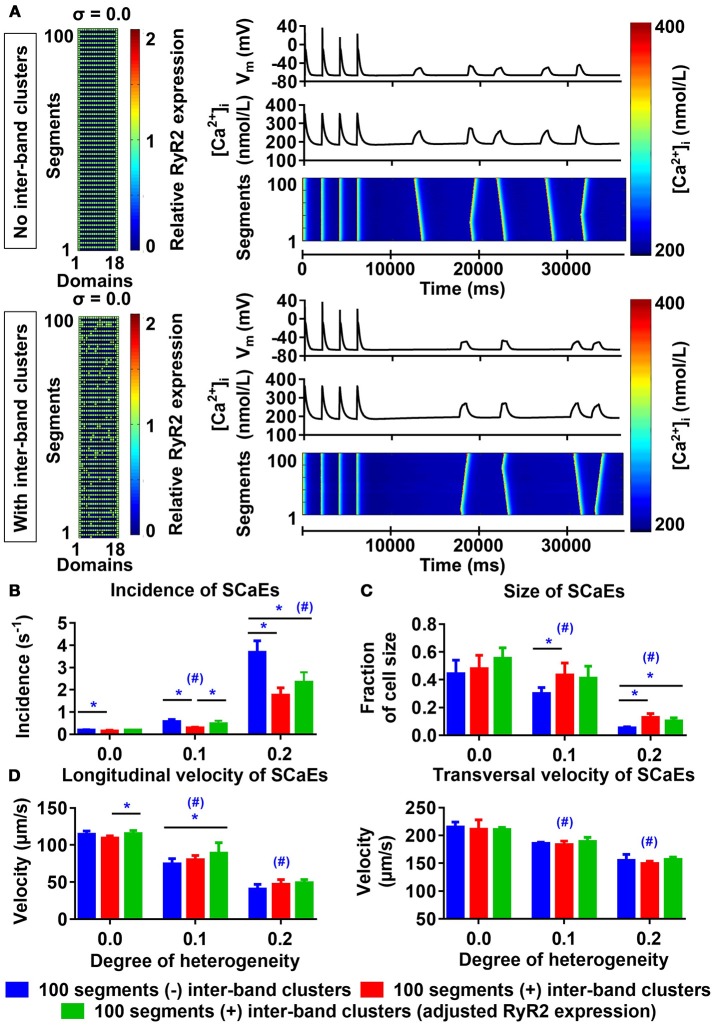
Effects of inter-band RyR2 clusters on spontaneous Ca2+ waves (SCaEs). (A) Comparison of RyR2 expression matrix (left), membrane potential (VM), whole-cell Ca2+ transient, and longitudinal line scan (right, top to bottom) in the model without inter-band RyR2 clusters (top) and with inter-band clusters (bottom) with uniform RyR2 expression (σ = 0.0). (B–D) SCaE incidence (B) and size (C), as well as longitudinal and transversal velocity of Ca2+ waves (D) as a function of RyR2 heterogeneity σ (0.0–0.2) in the absence of inter-band RyR2 clusters (blue), in the presence of 10% inter-band RyR2 clusters (red), or in the presence of 10% inter-band RyR2 clusters with increased global RyR2 expression to ensure similar RyR2 density within the bands (green). *indicates P < 0.05 between groups and #indicates P < 0.05 between a given level of heterogeneity and the group with heterogeneity 0.0; n = 6 per condition.

