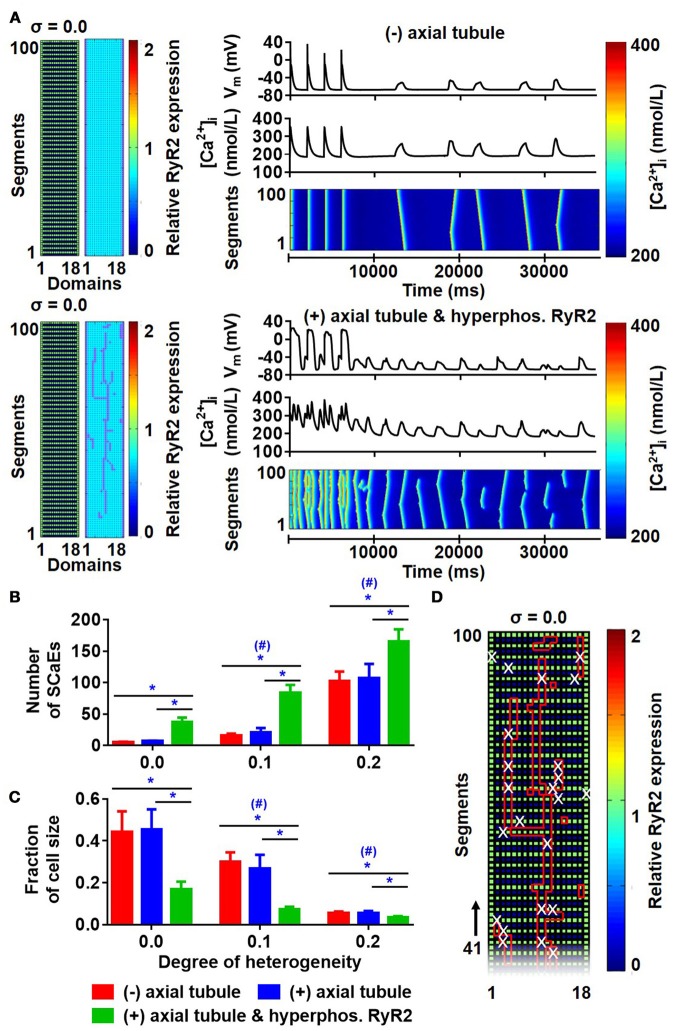
Figure 9.
Effects of axial tubules on SCaEs. (A) Comparison between the model without axial tubules and model with axial tubules with uniform RyR2 expression (σ = 0.0), but hyperphosphorylated RyR2 around axial tubules. (B,C) Number of Ca2+ waves (B) and SCaE size (C) in the absence of axial tubules (red bars), presence of axial tubules (blue bar), or presence of axial tubules with hyperphosphorylation of surrounding RyR2 (green bars). (D) Distribution of RyR2 expression and location of axial tubules (red lines) in relation to the origin of SCaEs (white crosses), showing that SCaEs primarily originated from RyR2 clusters adjacent to the axial tubules. *indicates P < 0.05 between groups and #indicates P < 0.05 between a given level of heterogeneity and the group with heterogeneity 0.0; n = 6 per condition.

