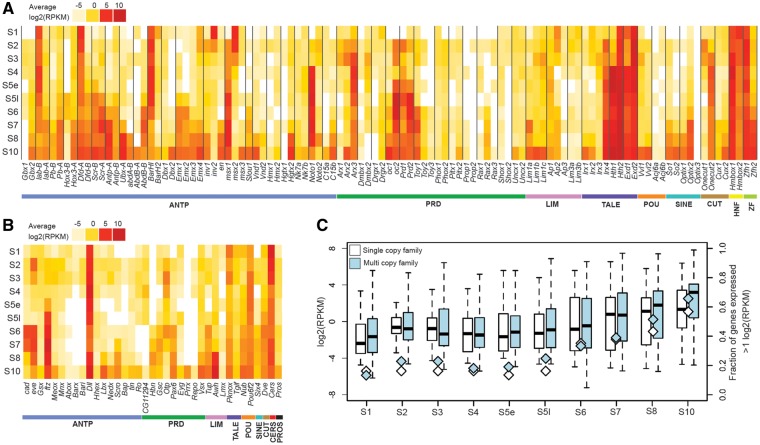
Fig. 3.
Expression of homeobox genes in Parasteatoda tepidariorum from S1 to S10. The transcriptome profile of P. tepidariorum AUGUSTUS gene models for (A) duplicated and (B) single copy Homeobox genes. (C) The average expression of all homeobox genes increases from S1 to S2, likely corresponding to onset of zygotic transcription (Pechmann et al. 2017). The numbers of families expressed >1 log2(RPKM) also increase from S1 to S2. The mean expression level is lower and fewer families are expressed around S4/S5e. After which the mean expression level and number of families continues to increase.

