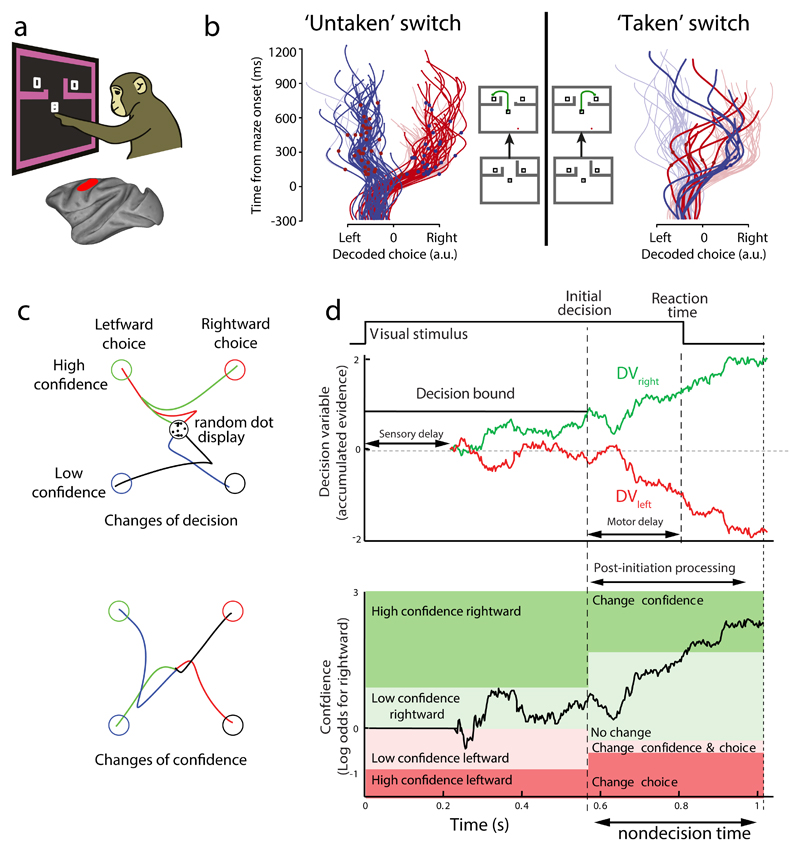
Fig. 4. Evidence for changes of mind.
a| The schematic depicts a decision-maze task, in which monkeys were presented with two targets surrounded by barriers that could change configuration during a trial103. Neural population activity was recorded using 96-electrode arrays in the dorsal premotor cortex (PMd) and primary motor cortex (M1). b| In switch trials, initially only one target was attainable, but the barrier configuration could be switched so as to make a second, previously unattainable target, the easiest target to attain. Trials in which the monkey either did not, or did, take advantage of the switch are shown in the left and right panels, respectively. A decoding algorithm for target choice (left or right) was trained using neural population activity from forced-choice trials, in which only one target was attainable, and used to predict target choice in switch trials over time from the activity recorded during switch trial performance. The traces depict decoded final target choice over time for single trials in which the left or right target was ultimately chosen (blue traces or red traces, respectively). The red and blue dots superimposed on the traces indicate the time of the barrier switch. These findings not only show that free choice trials are neurally represented in a similar fashion to forced-choice trials, but that, on the barrier switch trials, the neural activity would sometimes initially indicate one choice, before switching to the opposite choice, consistent with a change of mind. c| Trajectory revision in response to post initiation processing116. In this study, human subjects watched a noisy random dot display, wherein the direction coherence of the dots was varied, and had to indicate both the net direction of motion of the dots (left vs. right) and how confident they were in their choice (high vs. low) by reaching from a central location to one of four choice targets. Although the random dot display was extinguished on movement initiation, a small percentage of trials showed changes in reach paths (traces) indicative of changes of decision (top) or changes of confidence (bottom; only trials in which a change of decision/confidence are shown)d| A drift diffusion model can account for initial decisions, confidence and reaction times, as well as for changes of decisions and confidence. In this model, noisy momentary evidence of the direction of dot motion accumulates in two processes providing evidence for rightward (green trace) and leftward motion (red trace), respectively. The first process to cross a decision bound determines the initial choice (rightward in this case, top plot). There is a correspondence between the level of the accumulated evidence, the elapsed time and the confidence (log odds, bottom plot) that a rightward decision would be correct. In the model, the boundaries between confidence/choice combinations can change after the initial decision (vertical dashed line) to capture the physical cost of altering the reach for a change of mind. In the example trial shown, the boundary between low and high confidence for rightward motion changes after the initial decision, requiring greater evidence to be accumulated (black trace) in favour of high confidence before the participant changes their confidence decision during movement, as in this example. Non-decision time refers to the sum of sensory and motor delays, and corresponds to the unused information that can be processed after commitment to an initial choice (post-initiation processing). Parts a and b are adapted, with permission, from REF 103 Parts c and d are adapted, with permission, from REF 116.

