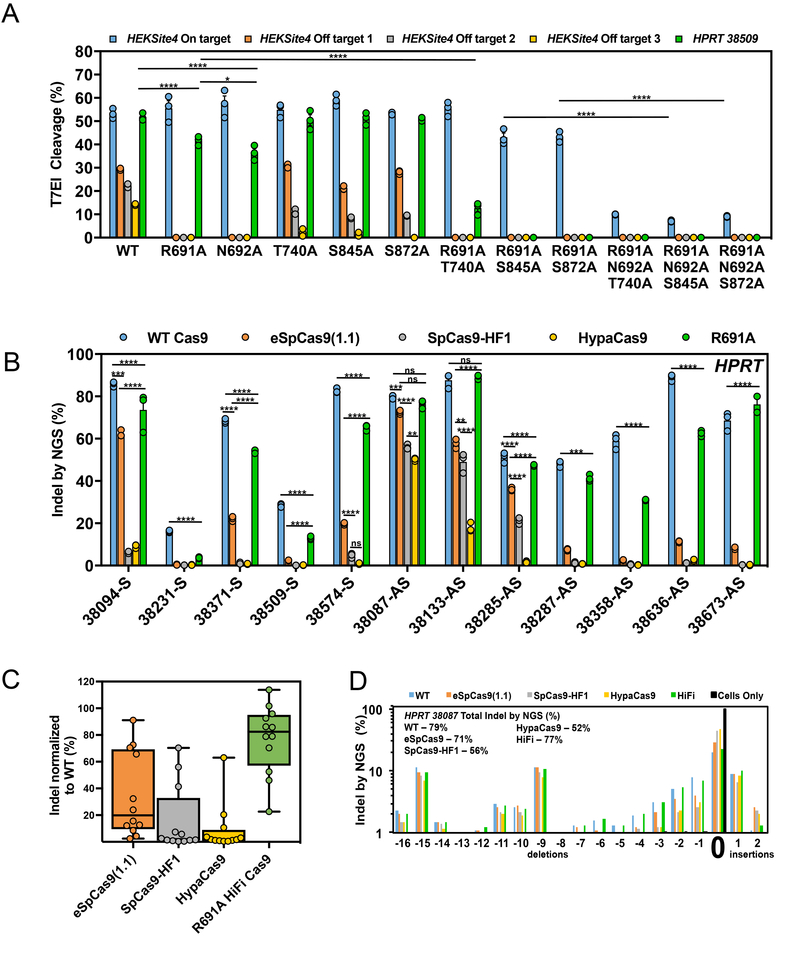
Figure 3. The R691A high fidelity (HiFi) Cas9 mutant maintains editing activity when delivered as an RNP.
(a) On-and off-target editing efficiency of the WT and bacteria-selected mutant Cas9 proteins with crRNAs that target the HEKSite4 (blue – on-target, orange – off-target 1, gray – off-target 2, yellow – off-target 3) and HPRT-38509 (green - on-target) loci in HEK293 cells. (b) On-target editing efficiency of WT Cas9 (blue), eSpCas9(1.1) (orange), SpCas9-HF1 (gray), HypaCas9 (yellow), and R691A (green) mutant proteins examined using 12 crRNAs that target different sites within the HPRT locus. Numbers included in the target site name indicate the first nucleotide of the target site with respect to the transcription start site of HPRT. Bars represent mean ± s.e.m., n=3 independent experiments performed at different times. (c) Box and whiskers plot showing aggregated on-target efficiency data of the eSpCas9(1.1) (orange), SpCas9-HF1 (gray), HypaCas9 (yellow), and R691A (green) mutants examined at the HPRT locus in Fig. 3b. The on-target editing efficiencies for each mutant at each site were normalized as a percent of WT Cas9 to account for varying editing efficiencies between guides. Horizontal lines represent median while showing the maximum and minimum values, n=12 from aggregated data in Fig. 3b. (d) Repair profile plot demonstrating the frequency and location of deletions and insertions relative to the unaltered HPRT-38087 target cleavage site (indicated by “0”). Experiments were performed with cells only (black bars), WT Cas9 (blue bars), eSpCas9(1.1) (orange bars), SpCas9-HF1 (gray bars), HypaCas9 (yellow bars), and HiFi (green bars). The overall INDEL frequencies for each experiment are indicated. Bars represent mean ± s.e.m., n=3 independent experiments performed at different times. For statistical comparisons, compare the edge of both sides of the horizontal lines. *P<0.05, **P<0.01, ***P<0.001, ****P < 0.0001, NS (not significant) = P ≥ 0.05, two-way analysis of variance (ANOVA) and Tukey’s multiple comparisons test.

