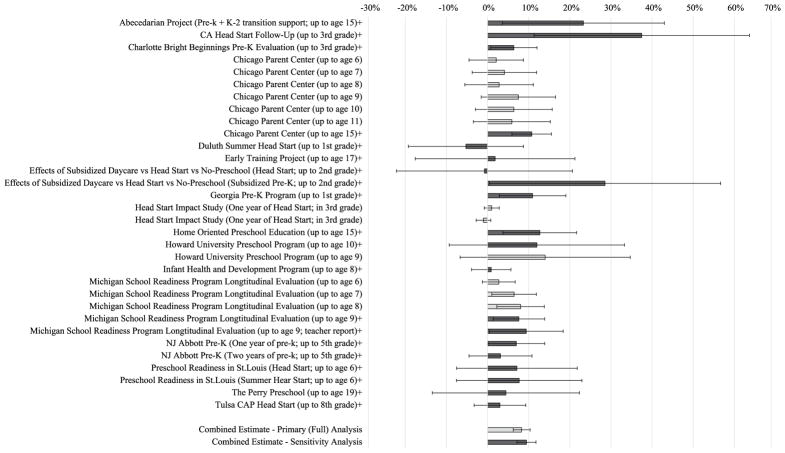
FIGURE A2. Percentage point reduction in grade retention rates (with 95% confidence intervals) for children attending early childhood education versus control group (selected programs with available data).
+ and dark grey bars identify those observations included in sensitivity analyses using a reduced sample. Seven additional observations (six from the Currie and Thomas NLSCM fixed effect study and one from the NLSY79 Head Start regression discontinuity study) included in primary analyses but not shown due to lack of percentage point data.

