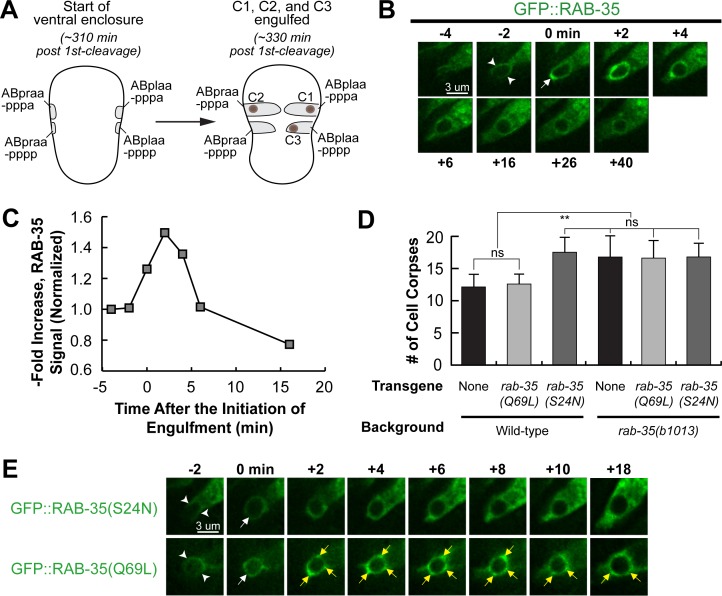
Fig 2. RAB-35 is localized to extending pseudopods and further enriched on nascent phagosomes.
All GFP reporters are expressed in engulfing cells under the control of Pced-1. (A) Diagram illustrating the features that help us visualize ventral enclosure and apoptotic cell clearance. The start of ventral enclosure is defined as the moment the two ventral hypodermal cells (ABpraapppp and ABplaapppp) start extending to the ventral midline. Both the position of cell corpses C1, C2, and C3 (brown dots) as well as the identity of their engulfing cells are shown. (B) Time-lapse recording of GFP::RAB-35 during the engulfment and degradation of cell corpse C3 in a wild-type embryo. “0 min”: the moment a nascent phagosome is just formed. Arrowheads mark the extending pseudopods. One arrow marks the nascent phagosome. (C) Graph showing the relative GFP::RAB-35 signal intensity over time on the surface of pseudopods and the phagosome shown in B. The GFP signal intensity was measured on the phagosomal surface and in the surrounding cytoplasm every 2 minutes, starting from the “-4 min” time point. The phagosomal / cytoplasmic signal ratio over time was presented. Data is normalized relative to the signal ratio at the “-4 min” time point. (D) Bar graph presenting the mean numbers and sd (error bars) of cell corpses scored in 1.5-fold stage wild-type or rab-35(b1013) mutant embryos, in the presence or absence of transgenes overexpressing GFP::RAB-35(S24N) or GFP::RAB-35(Q69L). For each data point, at least 15 animals were scored. Brackets above the bars indicate the samples that are compared by the Student t-test. p-values are summarized as such: *, 0.001 < p < 0.05; **, 0.00001 < p <0.001; ***, p <0.00001; ns, no significant difference. (E) Time-lapse images exhibiting the localization of GFP::RAB-35(S24N) and GFP::RAB-35(Q69L) during the engulfment and degradation of C3. “0 min” is the moment a nascent phagosome is just formed. Arrowheads mark extending pseudopods. A white arrow marks the nascent phagosome. Regions with enriched GFP::RAB-35(Q69L) signal on the phagosomal membrane are marked by yellow arrows.

