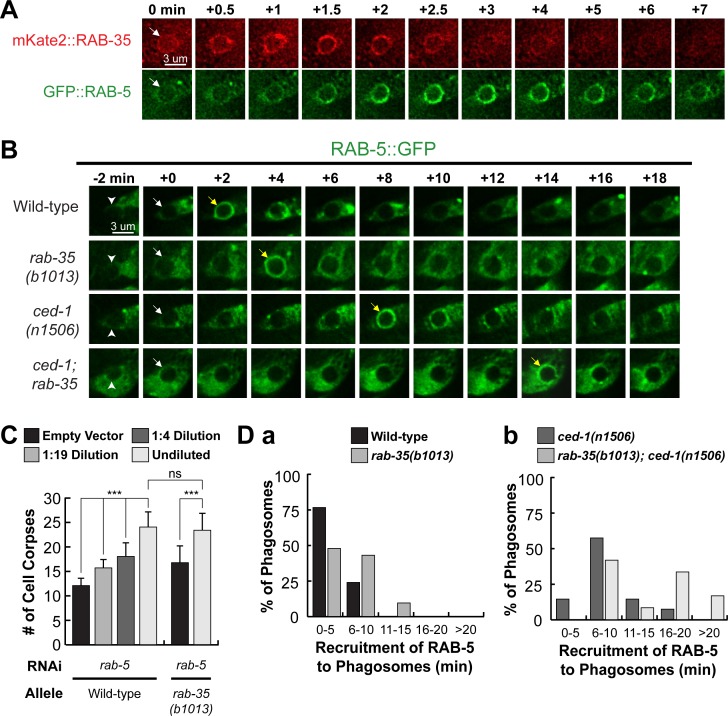
Fig 8. rab-35 functions upstream of and promotes the phagosomal localization of rab-5.
(A) Time-lapse images starting from the completion of phagosome formation (“0 min” time point) of a phagosome carrying C3 in a wild-type embryo co-expressing Pced-1 mKate2::rab-35 and Pced-1 gfp::rab-5. An arrow in each strip marks the nascent phagosome. (B) Time-lapse images during and after the formation (“0 min” time point) of a phagosome carrying C3 in a wild-type embryo expressing Pced-1 gfp::rab-5. Arrowheads indicate extending pseudopods. White and yellow arrows mark the nascent phagosome and the phagosome onto which RAB-5 is first seen localized to, respectively. (C) Epistasis analysis results performed between rab-5 and rab-35. rab-5 was inactivated by feeding worms with different dilutions of E. coli carrying the RNAi construct. The numbers of cell corpses were scored in the 1.5-fold stage F1 embryos. For each data point, at least 15 embryos were scored. Mean ± sd are presented. *, 0.001 < p < 0.05; **, 0.00001 < p <0.001; ***, p <0.00001; ns, no significant difference. (D) Histograms displaying the range of time it takes for the appearance of RAB-5 on the surface of phagosomes bearing C1, C2, and C3 in embryos of various genotypes. The time interval between the “0 min” time point and the first time point that the GFP::RAB-5 signal is observed enriched on the phagosomal surface of at least 15 phagosomes for each genotype are displayed.

