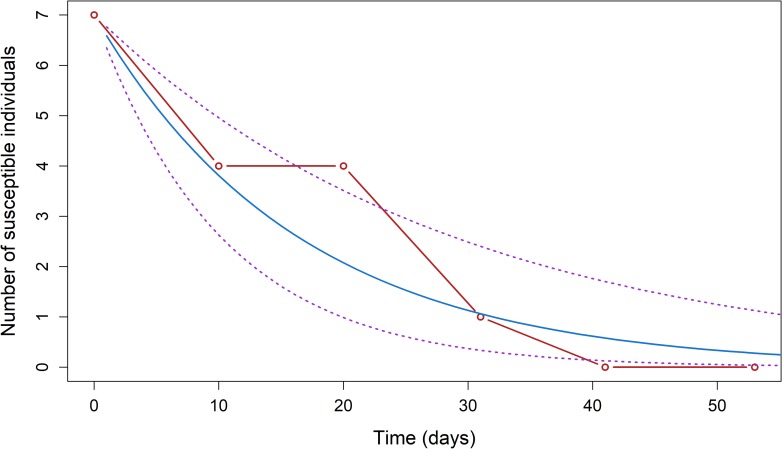
Fig 4. Progression of the number of susceptible pigs S(t) observed (red) and predicted (blue) using a generalized linear model with the 95% confidence interval (dotted purple lines) for the Ta Khmau peri-urban cohort (λ = 0.061 (0.034–0.098); S(0) = 7), Cambodia, 2015.
Time 0 on the graph was defined as the date at which the number of susceptible pigs was the highest and subsequently followed an exponential decrease.

