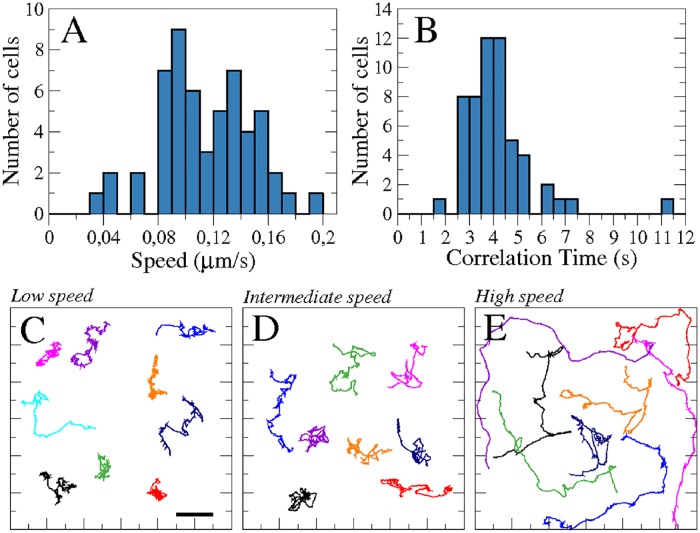
Fig 1. Dynamics of a population of 55 cells.
Histogram of the averaged speed of the cells (A), and the characteristic correlation time (B). Individual trajectories of cells classified by their averaged speed: Low, intermediate, and high speed corresponding, respectively, to 0.09-010 μm/s (N = 9 cells) (C), 0.12-013 μm/s (N = 8 cells) (D), and 0.15-019 μm/s (N = 8 cells) (E). Panels (C), (D), and (E) have the same spatial scales. Scale bar in panel (C) corresponds to 10 μm.

