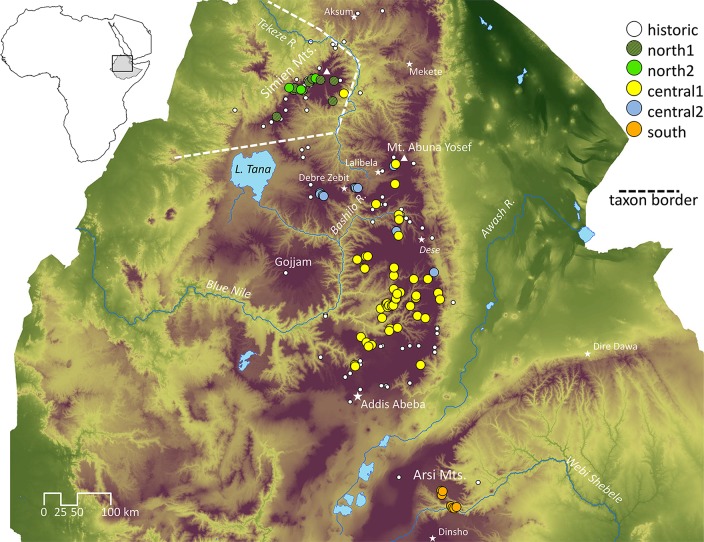
Fig 1. Geographic distribution of gelada sampling sites in the Ethiopian highlands.
Collection of samples for this study was conducted from 2014–2016. Dashed line = proposed border between T. g. gelada (west of border) and T. g. obscurus according to [29]. White circles = historical gelada records (some of which are disputed) according to [19]; coloured circles = our sampling sites, colours indicate haplogroup affiliation. Digital Elevation Model (DEM) base map [41].

