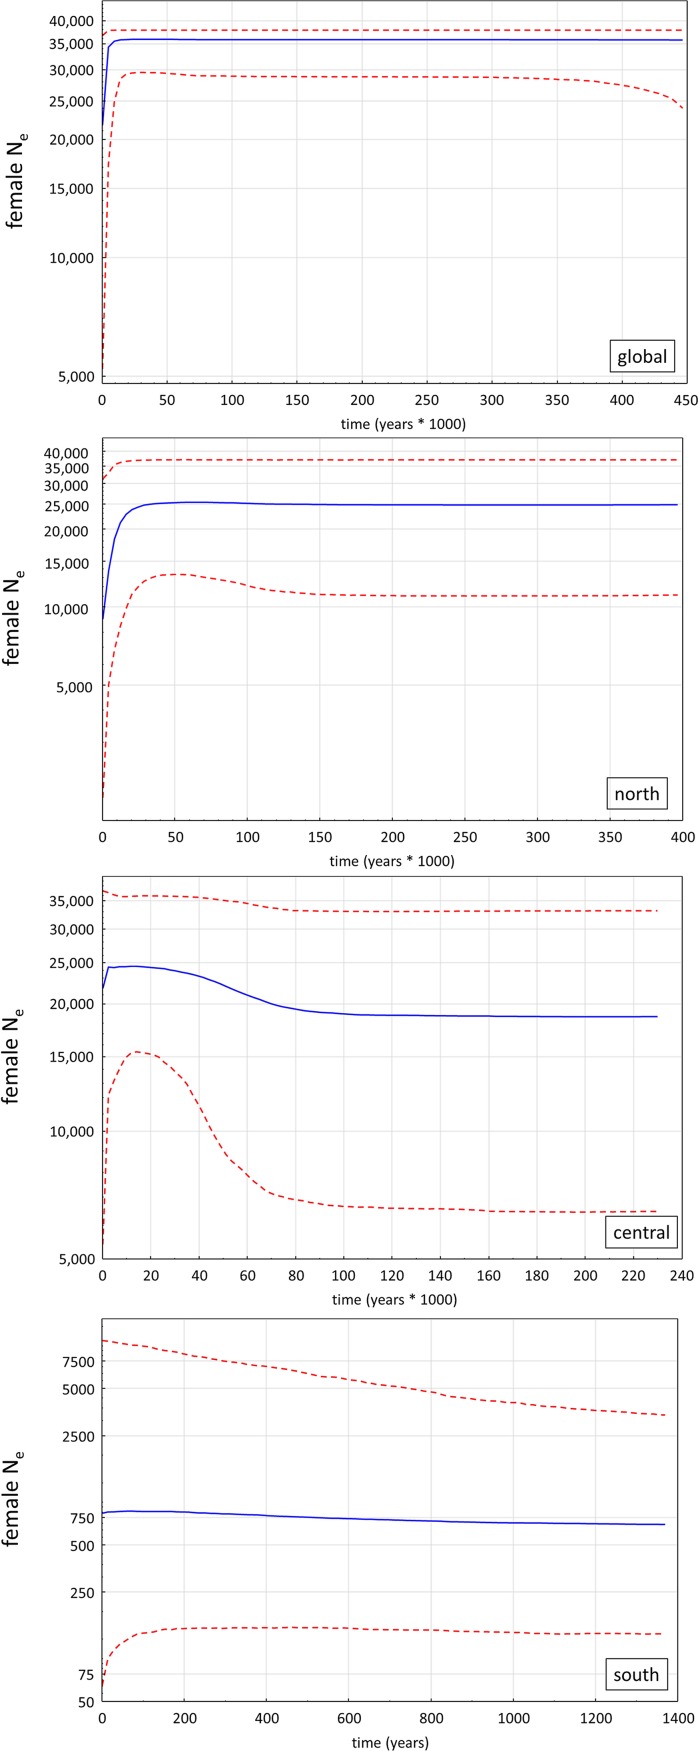
Fig 4. Bayesian skyline plots (BSPs) of the global gelada population and the three demes (north, central and south).
The y-axes show respective effective population sizes of females (Ne) in a log scale. Blue lines denote the median effective population sizes, red broken lines indicate respective 95% HPD limits.

