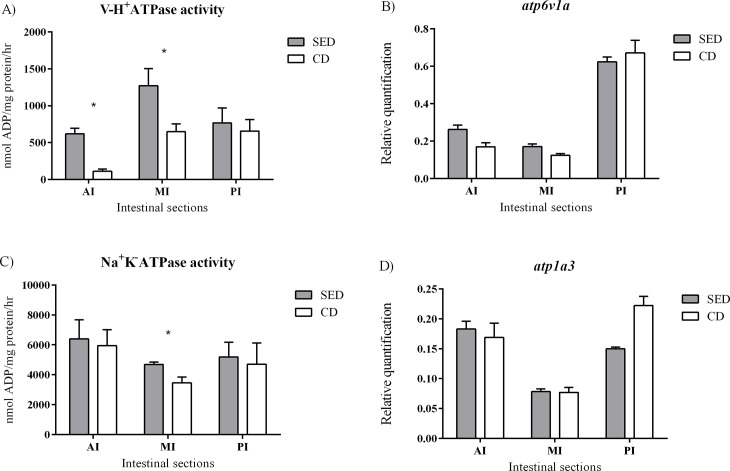
Fig 4.
Activity assay of V-H+-ATPase (A) and Na+K-ATPase (C) and relative quantification of mRNA expression of atp6v1a (B) and atp1a3 (D) at the anterior (AI), middle (MI) and posterior (PI) intestine between the treatments. The values for the activity assay are nmol ADP/ mg protein/hr. N = 6, asterisks indicate a significant difference between the treatments (P<0.05).

