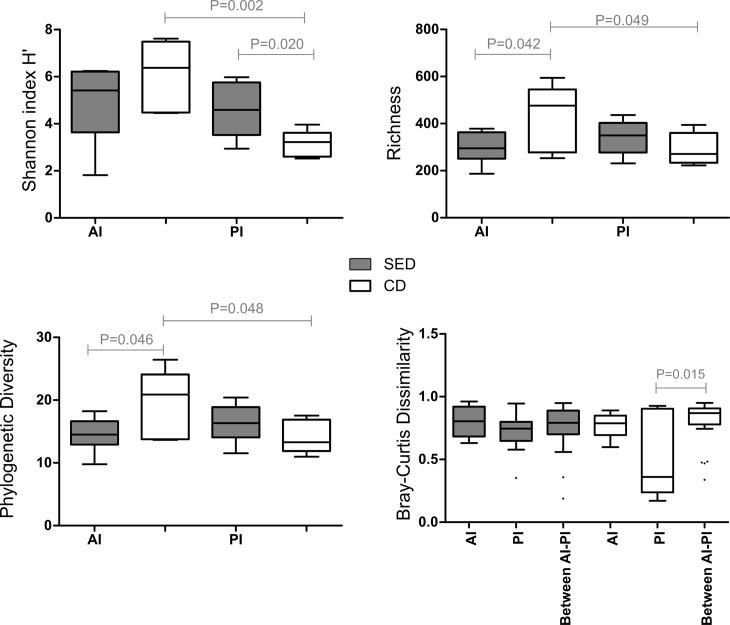
Fig 6.
Microbial alpha-diversity measured by (A) Shannon H’, (B) richness, and (C) phylogenetic diversity indices in the anterior (AI) and posterior (PI) intestine between the treatments. (D) Microbial composition (beta diversity) measured by Bray Curtis index, comparing within and between parts dissimilarity of each group. Horizontal line in the box plots represents the median and whiskers indicate the lowest and highest point within 1.5 interquartile ranges of the lower or upper quartile, respectively. One-sided Student t-test was performed for the alpha diversity analysis (A-C), while for the Bray Curtis dissimilarity index, non-parametric P-values were calculated with 1000 Monte Carlo simulations and were Bonferroni-corrected.

