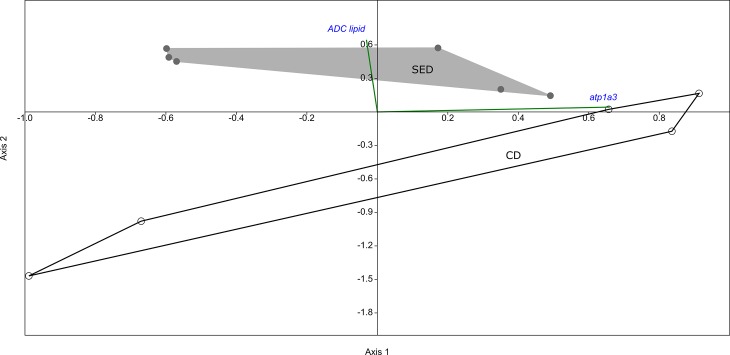
Fig 7. Canonical correspondence analysis (CCA) of the posterior intestine (PI) microbiome showing the two groups (SED and CD) forming two separate clusters, where each dot (either gray or white, respectively) is indicating an individual fish microbiome.
The physiological parameters ADC lipid and atp1a3 are plotted (green lines) as correlations with the PI microbiome of the treatments. The ADC lipid was positively correlating, and thus has a direction towards the SED group, while the atp1a3 was negatively correlating with the SED group and thus positively with the CD group.

