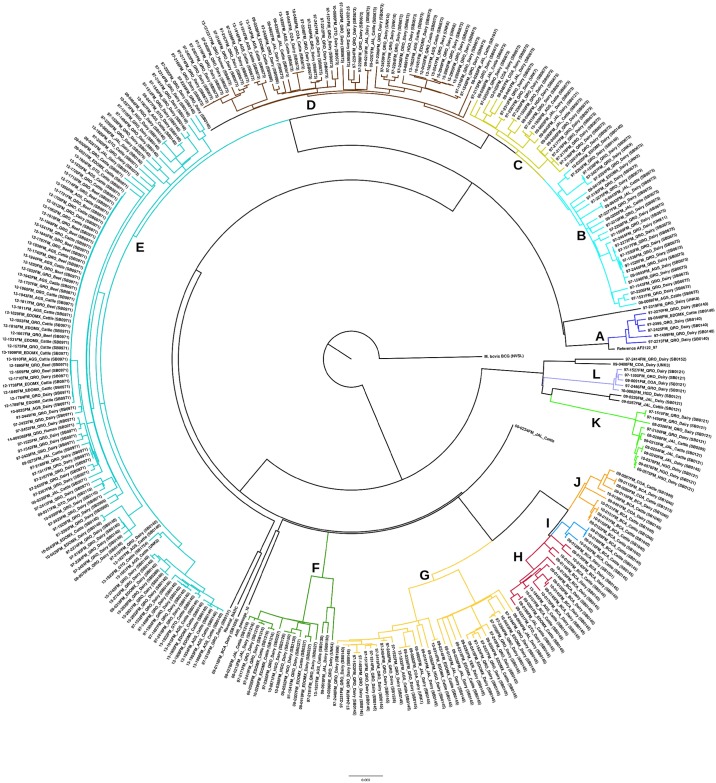
Fig 4. Phylogeny of M. bovis isolates.
Radial representation of molecular phylogenetic analysis by Maximum Likelihood (RAxML) method based on whole-genome SNP sequences of 322 isolates of M. bovis from Mexico. Groups are represented by colors: A (blue), B (cyan), C (light green), D (brown), E (light blue), F (green), G (yellow), H (red), I (bright blue), J (orange), K (lime), L (lila).

