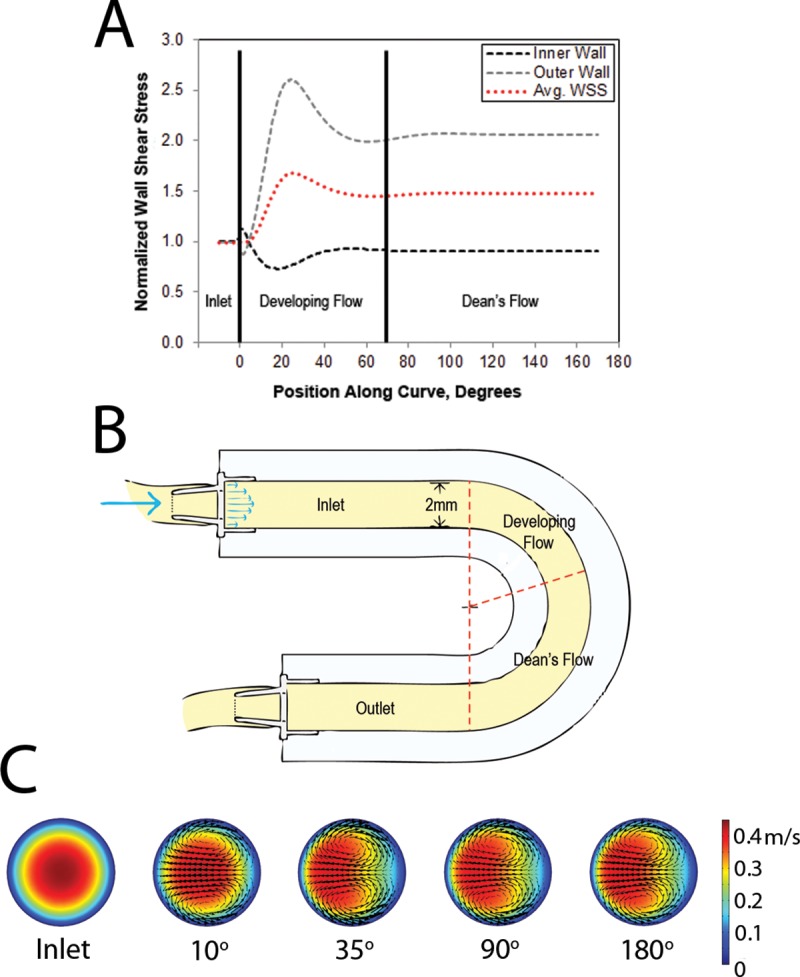
Fig 1. Overview of curved model and associated fluid dynamics.

(A) WSS plot normalized to inlet WSS of 10 dyne/cm2 with 3 defined regions of curvature, (B) schematic drawing of 180o curve model with regions of curvature annotated and (C) Cross-sectional velocity plots at different positions along the curve demonstrating secondary flows and fluid momentum shift (right: inner wall, left: outer wall).
