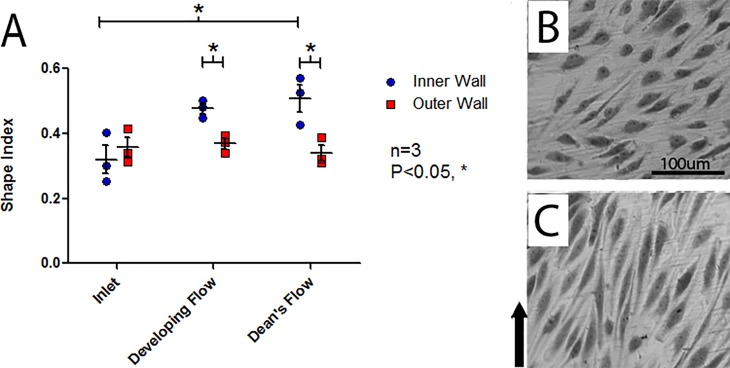
Fig 3. Analysis of shape index of HAAECs.
(A) Analysis of shape index of HAAECs on the inner and outer walls of curvature following 24hr of flow conditioning at an inlet WSS of 10dyne/cm2 (n = 3, mean SI ± SEM). The inner wall in the Dean’s flow region had a significantly higher SI than the inlet inner wall (Bonferroni post-hoc test, P<0.05). The developing and Dean’s flow regions also exhibited a significantly higher SI on the inner wall compared to the outer wall in the same region (Bonferroni post-hoc test, P<0.05 and P<0.05, respectively). Representative images used for analysis from Developing Flow region, with direction of flow indicated, in the (B) inner wall of curvature (average shape index = 0.51) and (C) outer wall of curvature (average shape index = 0.34) with direction of flow identified with an arrow.

