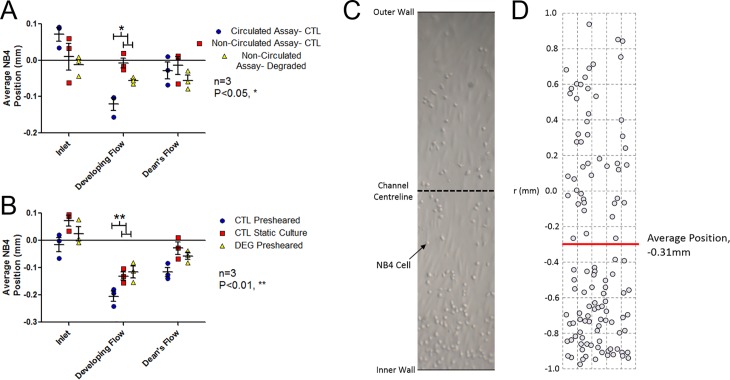
Fig 5. Average position of adhered NB4s relative to the centreline with the inner wall in the negative direction and outer wall in the positive direction.
(A) Both circulated (inlet WSS of 1 dyne/cm2) and non-circulated (no WSS) adhesion assays for statically cultured control (CTL) and HS-degraded (DEG) HAAECs (n = 3, mean average position ± SEM). The developing flow region of the circulated adhesion assay showed a significant bias towards the inner wall compared to static controls (Bonferroni post-hoc test, P<0.05). (B) Mean average position of circulated (inlet WSS of 1 dyne/cm2) adhesion assays following 24hr preshearing (inlet WSS of 10 dyne/cm2) or static culture. Controls exhibited a significant bias in adhesion to the inner wall in the developing flow region relative to HS-degraded HAAECs (Bonferroni post-hoc test, P<0.01). (C) Representative image of the full model diameter used for analysis from the Dean’s Flow region of circulated adhesion assay of CTL presheared HAAECs. (D) Analysis of the image collecting coordinates of each adhered NB4 cell to determine average position as reported in (A) and (B), demonstrating a bias to the inner wall of curvature.

