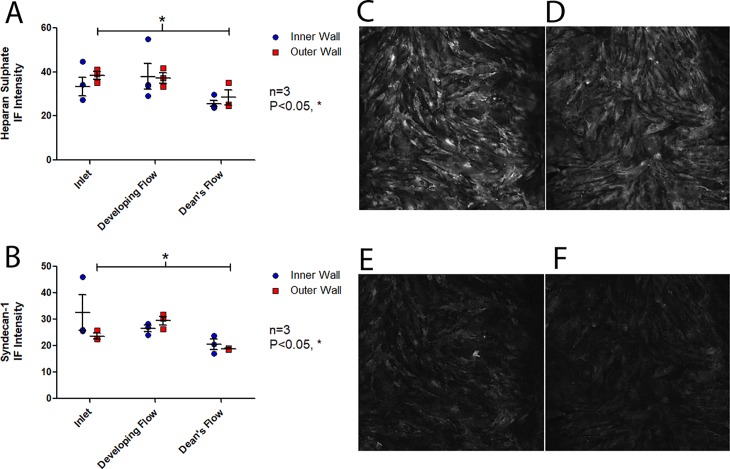
Fig 6. Immunofluorescence staining of HS and Syndecan-1.
Following 24hr of flow conditioning (inlet WSS of 10 dyne/cm2), mean fluorescence intensity (n = 3, mean intensity ± SEM) of (A) of HS which showed a significant decrease in mean intensity in the Dean’s flow region relative to the inlet (Bonferroni post-hoc test, P<0.05) and (B) Syndecan-1 which also showed a significant decrease in mean intensity in the Dean’s flow region relative to the inlet (Bonferroni post-hoc test, P<0.05). Representative images of (C) Inlet and (D) Dean’s Flow HS immunofluorescence for the outer wall of curvature and (E) Inlet and (F) Dean’s Flow Synd-1 immunofluorescence for the outer wall of curvature.

