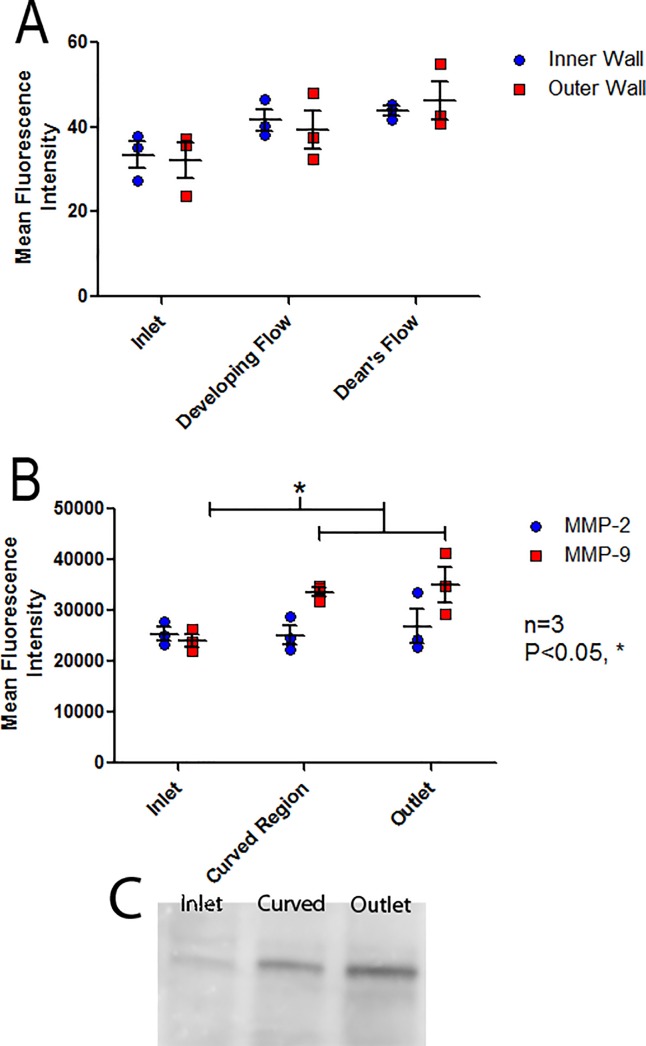
Fig 7. Analysis of MMP activity throughout the curved model.
(A) Regional MMP activity quantified by in situ gel zymography following treatment of HAAEC with DQ gelatin showing a trend for increased activity throughout the curve and (B) Regional MMP activity quantified by ex situ gel zymography showing a significant increase in MMP-9 activity in the curve and outlet regions of the model when compared to the inlet (Bonferonni post-hoc test, P<0.05). (n = 3, mean intensity ± SEM). (C) Representative zymography image from ex situ MMP-9 experiments.

