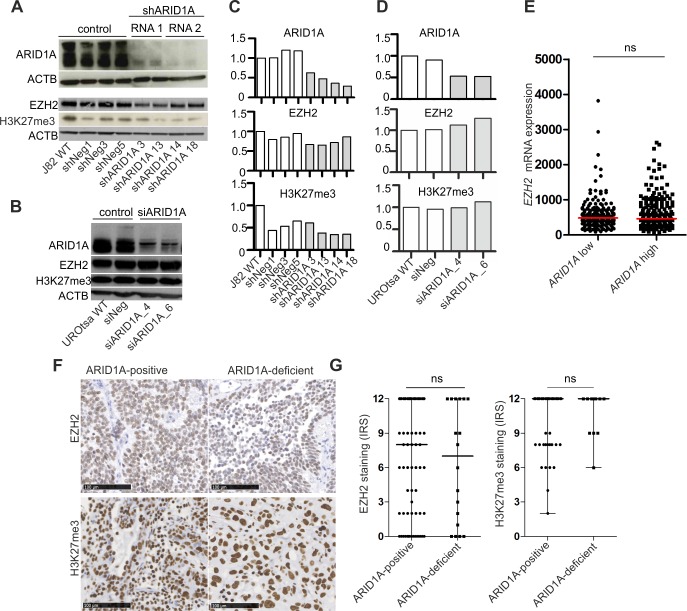
Fig 4. ARID1A-depletion in urothelial cells does neither increase EZH2 protein amount nor H3K27me3 levels.
ARID1A, EZH2 protein expression and amount of tri-methylated H3K27 (H3K27me3) in stably transfected J82 single-cell clones (A) and transiently transfected UROtsa cells (B). ACTB served as a loading control for western blot analysis. WT: wildtype. Densitometrical evaluation of the western blot results shown in A and B are depicted in (C) and (D), respectively. (E) EZH2 mRNA expression in urothelial carcinomas of the TCGA 2017 data set exhibiting “low” (n = 204) and “high” ARID1A (n = 204) mRNA expression. Dichotomization into both groups is based on median ARID1A mRNA levels in all tumor samples. ns: not significant (unpaired t test). (F) EZH2 protein expression and amount of tri-methylated H3K27 (H3K27me3) in ARID1A-positive (median ARID1A Remmele score: 12, n = 84 for EZH2 cohort and n = 105 for H3K27me3 cohort) as well as ARID1A-deficient (median ARID1A Remmele score: 0, n = 18) urothelial bladder carcinoma cases. Immunohistochemical images are representative of observed median expression of EZH2 and H3K27me3 in the respective group. Bar: 100μm. (G) Quantification of EZH2 and H3K27me3 levels by box plot analysis. Horizontal lines: grouped medians. Boxes: 25–75% quartiles. Vertical lines: range, minimum and maximum. IRS: immunoreactive score (Remmele score). ns: not significant (Mann-Whitney-U test).

