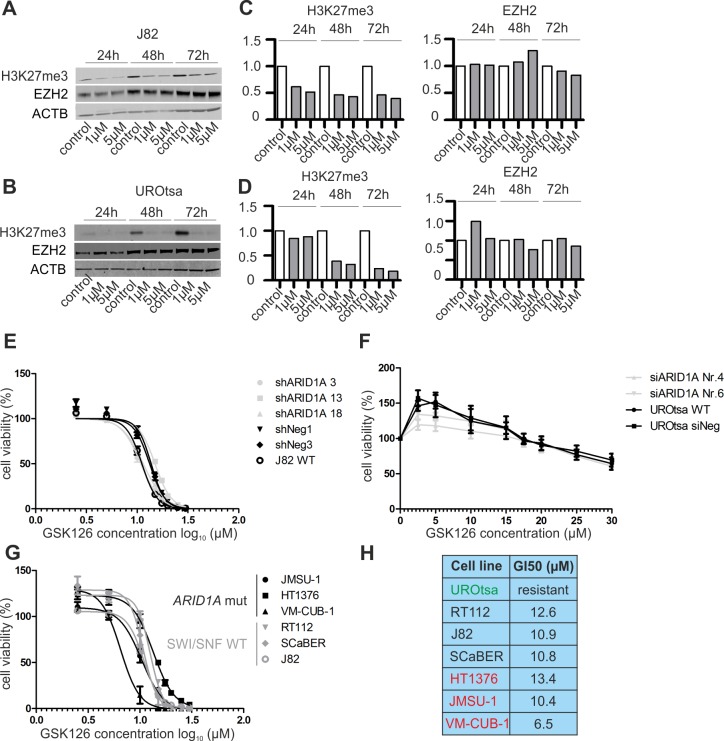
Fig 5. ARID1A-deficient urothelial cells show no enhanced sensitivity towards inhibition of enzymatic EZH2 activity.
Amount of tri-methylated H3K27 (H3K27me3) and EZH2 protein expression in J82 (A) and UROtsa (B) wildtype cells following GSK126 treatment for 24/48/72 hours in the indicated concentrations in comparison to DMSO control. Densitometrical evaluation of the western blot results shown in A and B are depicted in (C) and (D), respectively. (E) Dose-response curves for J82 ARID1A-depleted single-cell clones and controls treated with the indicated GSK126 concentrations for 72h. Error bars (n = 3): SEM. (F) Dose-response curves for UROtsa ARID1A-depleted cells and controls treated with the indicated GSK126 concentrations for 72h. Error bars (n = 3): SEM. (G) Dose-response curves for bladder cancer cell lines without genetic SWI/SNF alterations (RT112, SCaBER, J82) and ARID1A-mutated cells (HT1376, JMSU-1, VM-CUB-1) treated with the indicated GSK126 concentrations for 72h. Error bars (n = 3): SEM. WT: wildtype. (H) Determined growth IC50 (GI50) values for all cell lines treated with GSK126 for 72h. Green label: normal urothelial model UROtsa, black label: cell lines wihout genetic SWI/SNF alterations, red label: ARID1A-mutated cell lines.

