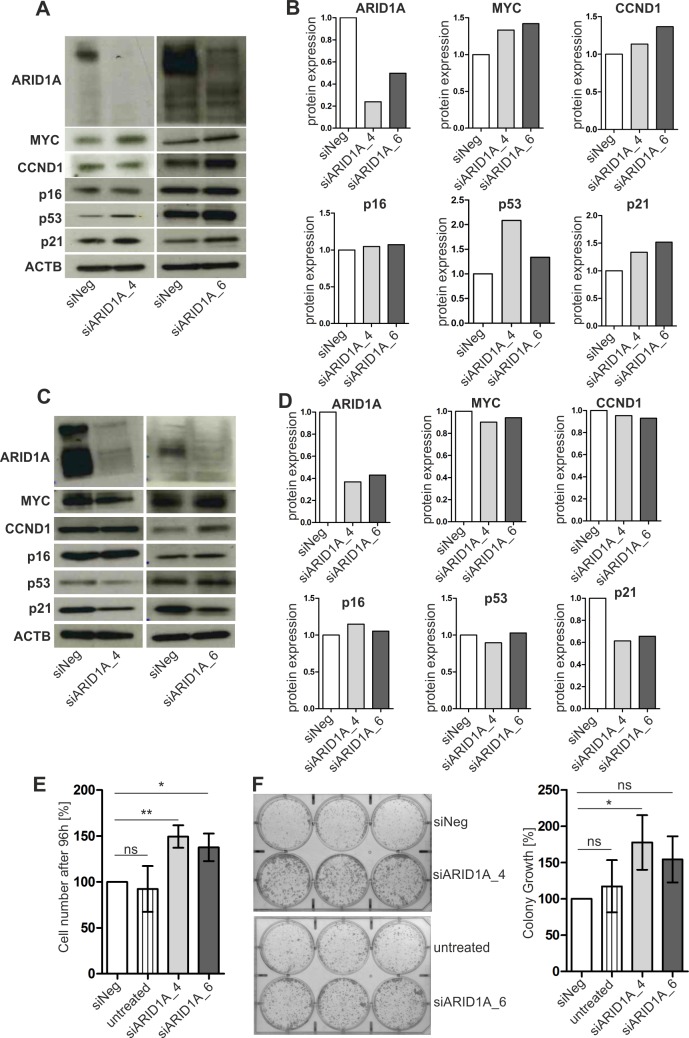
Fig 6. Impact of ARID1A on the expression of cell-cycle-related genes and cell growth of urothelial cells.
(A) Representative western blot analysis of TERT-immortalized normal human urothelial cells (TERT-NHUC) treated with two different ARID1A-specific siRNAs (siARID1A_4 and 6) and a negative control (siNeg). ACTB was used as a loading control. Experiments have been performed in triplicate. (B) Densitometrical evaluation of the western blot results shown in A. Protein expression of control cells (siNeg) was set to 1. (C) Representative western blot analysis of SV40 large T-antigen-immortalized UROtsa cells treated with two different ARID1A-specific siRNAs (siARID1A_4 and 6) and a negative control (siNeg). ACTB was used as a loading control. Experiments have been performed in triplicate. (D) Densitometrical evaluation of the western blot results shown in C. Protein expression of control cells (siNeg) was set to 1. (E) Cell growth analysis of UROtsa cells treated with two different ARID1A-specific siRNAs (siARID1A_4 and 6) in comparison to the siRNA negative control (siNeg) and UROtsa wildtype cells (untreated). The mean cell number after 96 hours cell growth of independent experiments (n = 3) was calculated. The values depicted were normalized to cellular growth of the siNeg control. Vertical lines: standard deviation of triplicates. * P <0.05, ** P <0.01, ns: not significant (repeated measures ANOVA, Tukey’s multiple comparison test). (F) Left: representative colony formation assay in six-well plates containing UROtsa cells treated with two different ARID1A-specific siRNAs (siARID1A_4 and 6) in comparison to a siRNA negative control (siNeg) and wildtype cells without treatment (untreated) two weeks after cell seeding. Right: Densitometrical evaluation of 2D colony growth of triplicate experiments. The mean colony growth was calculated and the data were normalized to colony growth of the control (siNeg). Horizontal lines: mean values of triplicate experiments. Vertical lines: standard deviation of triplicates. * P <0.05, ns: not significant (repeated measures ANOVA, Tukey’s multiple comparison test).

