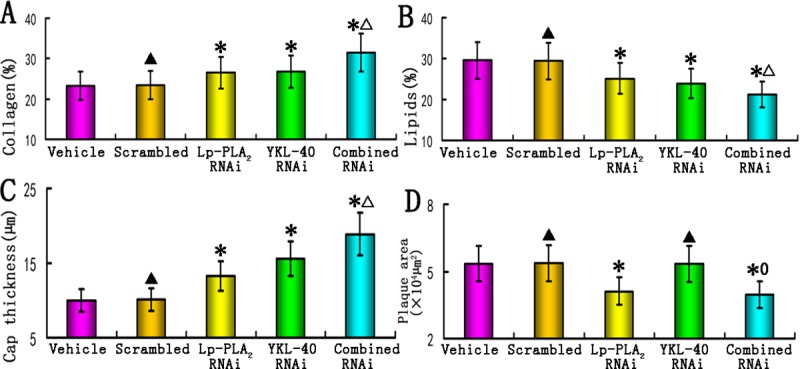
Fig 4. Comparison of plaque morphology.

(A) Comparison of relative collagen content in the plaques of the vehicle, scrambled, Lp-PLA2 RNAi, YKL-40 RNAi, and combined Lp-PLA2 and YKL-40 RNAi groups (n = 12); (B) Comparison of relative lipid content in the plaques from all groups (n = 12). (C) Comparison of fibrous cap thickness in the plaques of all groups (n = 12). (D) Comparison of plaque area in the plaques of all groups (n = 12). *P<0.05 vs. vehicle groups; ▲P>0.05 vs. vehicle group; △P<0.05 vs. Lp-PLA2 RNAi and YKL-40 RNAi groups. 0P>0.05 vs. Lp-PLA2 RNAi group.
