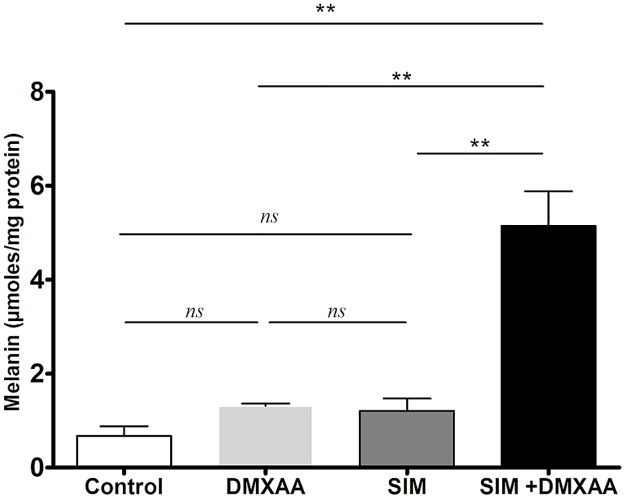
Fig 5. The effects of different treatments on the melanin content in the cell co-culture.
The results are expressed as mean ± SD of two independent measurements. Control = untreated cells in co-culture; DMXAA: cell co-culture incubated with 100 μM DMXAA; SIM: cell co-culture incubated with 3.5 μM SIM, SIM+DMXAA: cell co-culture incubated with 3.5 μM SIM administered in combination with 100 μM DMXAA. One way ANOVA test with Bonferroni correction for multiple comparisons was performed to analyze the differences between the effects of the treatments applied on melanin content (ns, P>0.05; **, P<0.01).

