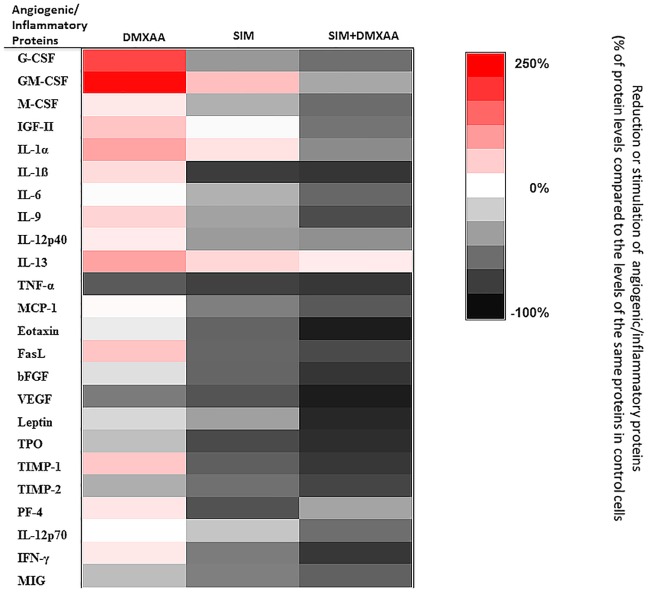
Fig 7. The effects of different treatments on angiogenic and inflammatory proteins production in the co-culture of B16.F10 melanoma cells and TAMs.
The protein levels after different treatments are compared with the levels of the same proteins in control cells. Data are expressed as average % of reduction (-) of protein levels ranging from 0% (white) to -100% (black) or stimulation (+) of production of proteins ranging from 0% (white) to +250% (red) compared with the levels of the same proteins in control cells. DMXAA: cells incubated with 100 μM DMXAA; SIM: cells incubated with 3.5 μM SIM, SIM+DMXAA: cells incubated with 3.5 μM SIM administered in combination with 100 μM DMXAA.

