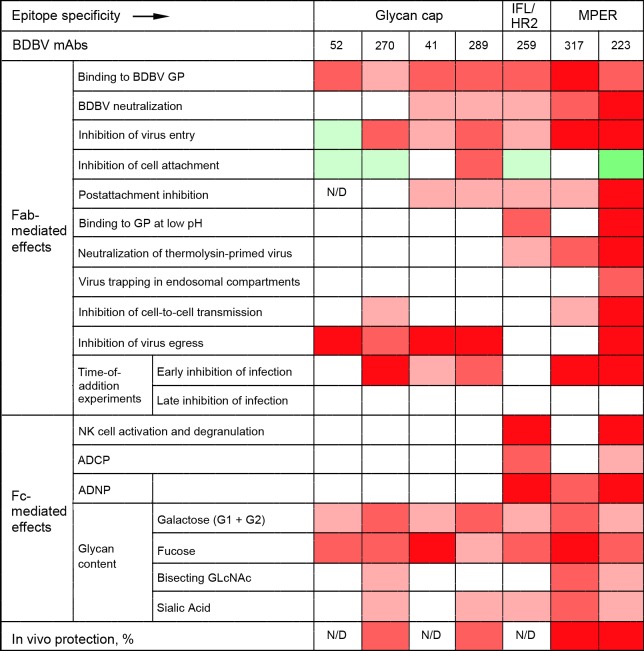
Fig 7. Summary of mAb effects: the greater diversity of stalk-specific mAbs compared to glycan cap-specific mAbs.
Four different shades of red indicate level of inhibition, and two shades of green indicate level of enhancement, with the most intense colors corresponding to the highest inhibition or enhancement, respectively. White indicates no activity. N/D, not determined.

