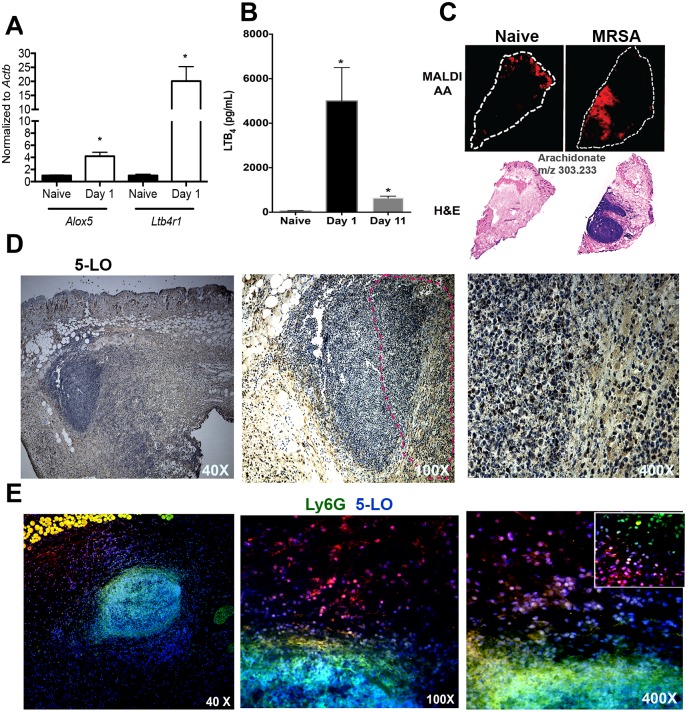
Fig 1. MRSA infection induces LTB4 production in areas close to the abscess.
A) Detection of Alox5 and Ltb4r1 from the uninfected naïve skin and day 1 post-MRSA skin infection as assessed by qPCR. B) LTB4 EIA from skin biopsy homogenates from uninfected naïve samples, days 1 and 11 post-infection. C) Top panel: MALDI imaging for AA (red) determined by imaging mass spectrometry as described in the Methods. Bottom panel: H&E stained sections of naïve skin and day 1 post-MRSA skin infection. White dotted line indicates the edge of the skin tissue section. D) Expression of 5-LO at 40 X (left panel) and 100 X (middle panel) and 400 X (right) magnification in mice at day 1 after MRSA infection. The 5-LO is shown in brown and counterstained in blue. Data are representative of 2–3 mice. Dotted lines indicate abscess edges. E) Detection of 5-LO (red) and Ly6G (green) in the skin of MRSA-infected mice at 40 X (left panel), 100 X (middle panel) and 400 X (right panel). The inset represents 1000 X amplification. Colocalization between nucleus (DAPI) plus 5-LO is shown as purple, and 5-LO plus Ly6G is shown in yellow. Data are the mean ± SEM from 3–6 mice from 2–3 experiments. *p < 0.05 vs. naïve.

