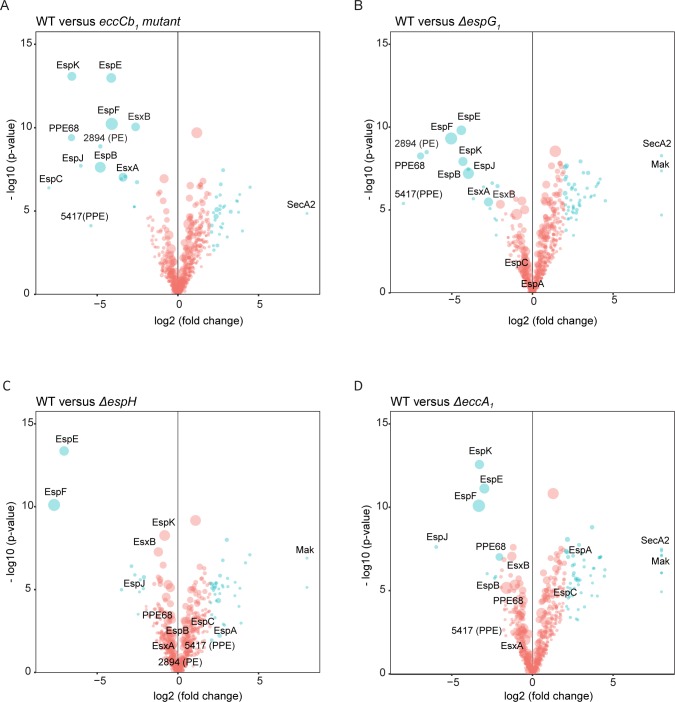
Fig 3. Quantitative proteomics analysis of the Genapol-enriched fractions of different M. marinum ESX-1 mutant strains.
Volcano plots representing the statistical significance of changes of cell-surface enriched proteins between the WT M. marinum and each ESX-1 mutant. The vertical lines depict p value on the–log base 10 scale. The horizontal lines denote fold change on the log base 2 scale. Only proteins with an accumulative number of more than 10 spectral counts are shown. Each dot corresponds to a single identified protein and the size of the dots correlates to the accumulative spectral counts of the protein of the WT and the corresponding mutant. Proteins with a spectral count difference of more than eight folds were set to eight. In blue: proteins that showed more than 4 folds of change, otherwise in red. Only putative ESX-1 substrates, SecA2 and Mak are annotated. A. WT versus the eccCb1 mutant. B. WT versus the ΔespG1 mutant. C. WT versus the ΔespH mutant. D. WT versus the ΔeccA1 mutant.

