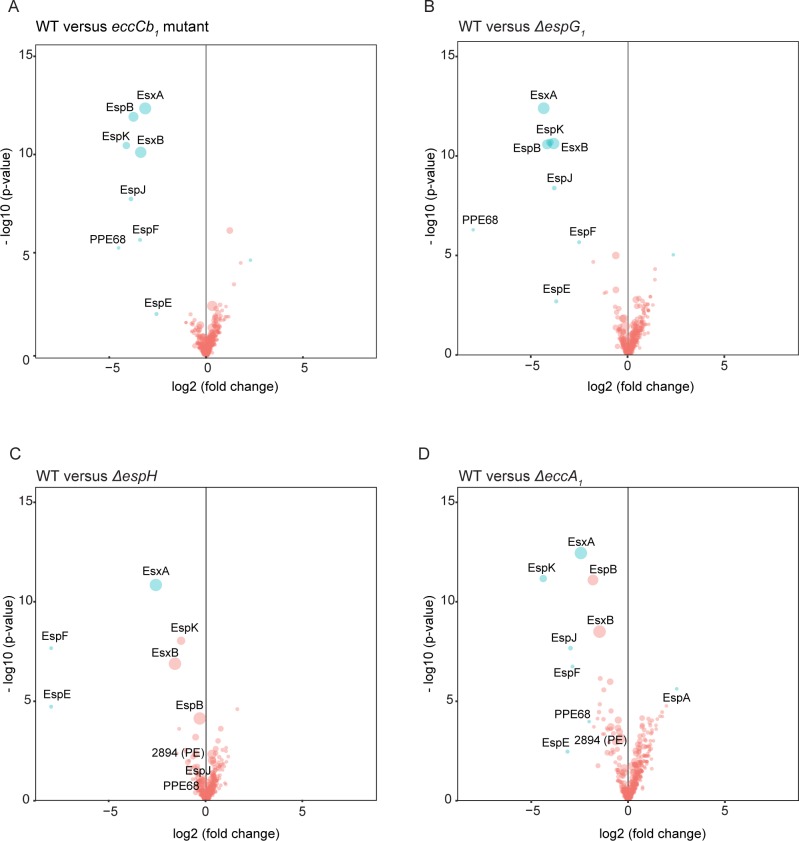
Fig 4. Quantitative proteomics analysis of the supernatant of different M. marinum ESX-1 mutant strains.
Volcano plots representing the statistical significance of changes of the secreted proteins in the supernatant between the WT M. marinum and each ESX-1 mutant. The same quantitative method was used as in Fig 3 for the Genapol-enriched fractions. A. WT versus the eccCb1 mutant. B. WT versus the ΔespG1 mutant. C. WT versus the ΔespH mutant. D. WT versus the ΔeccA1 mutant.

