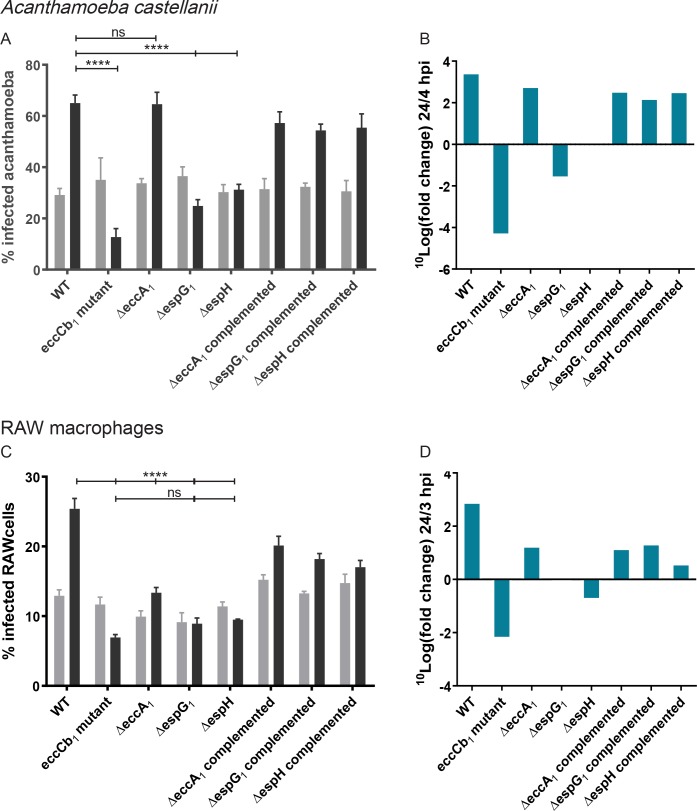
Fig 7. Intracellular growth of ΔeccA1, ΔespG1 and ΔespH in different hosts.
A. Flow cytometry experiment showing percentage of infected A. castellanii at 4 hours post infection (hpi) versus 24 hpi, graph shows pooled data from two independent experiments. B. Graph shows fold change in percentage infected A. castellanii presented in A. C. Similar flow cytometry experiment with infected RAW macrophages when comparing percentage infected cells at 3hpi and 24 hpi, graph shows representative data of 1 out of 3 biological replicates.,. D. Graph shows fold change in percentage infected RAW macrophages presented in C. **** = p<0.001, ns = non-significant.

