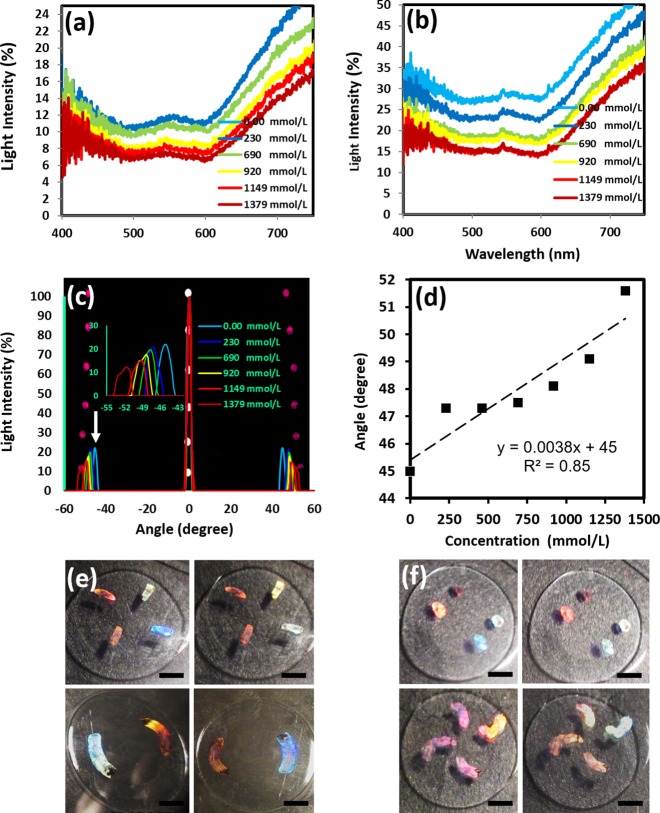
Figure 7.
Light transmission spectra as a function of Na+ ion concentrations: (a) dye-coated lens and (b) nanograting on the contact lens. (c) Diffraction measurements on the nanopatterned contact lens at different Na+ ion concentrations. (d) Variation with diffraction angles with Na+ ion concentrations (e–h) Different designs (rings/patches) of holographic nanostructures fabricated on contact lenses. Each image demonstrates the diffraction colors observed at various angles (scale bar = 5 mm).

