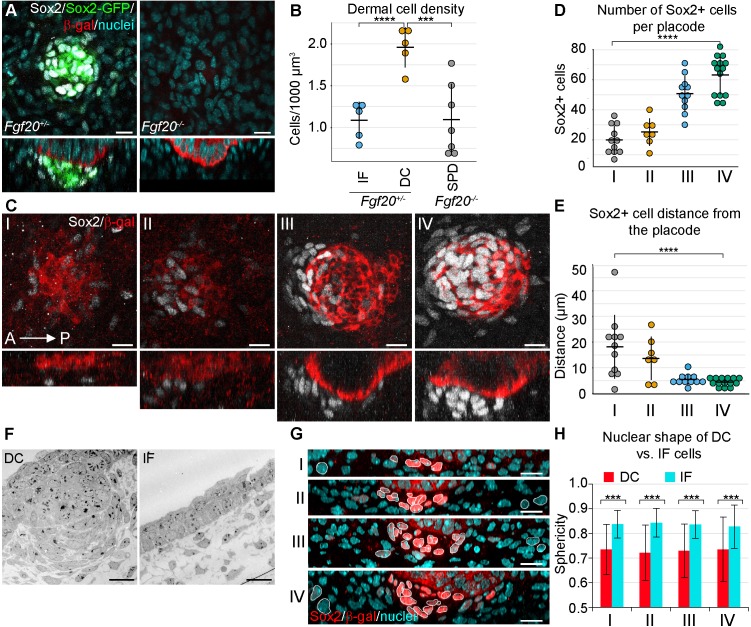
Figure 1. Changes in dermal cell characteristics upon dermal condensation induction.
(A) Confocal microscopy immunofluorescent optical sections (planar and sagittal views) of E14.5 control (Fgf20+/-;Sox2-GFP) and Fgf20-/-;Sox2-GFP (green) embryonic skin labelled with antibodies against Sox2+ (white) and β-galactosidase (β-gal, red) to visualize DC and placodes, respectively. Note the absence of Sox2 antibody staining and Sox2-GFP reporter in Fgf20-/- HFs. (B) Quantification of fibroblasts in E14.5 Sox2-GFP DC volume in Fgf20+/- DC and interfolliclular upper dermis (IF) as well as in Fgf20-/- dermis immediately adjacent to placodes (SPD), (n = 5 placodes from two skins Fgf20+/-; n = 6 placodes from two skins Fgf20-/-) unpaired Student’s T-test. (C) Confocal microscopy immunofluorescent optical sections (planar and sagittal views) of Fgf20+/- HF between E13.5 and E14.5, labeled with antibodies against Sox2 (white) and β-Gal (red). Placode morphogenesis was divided into four categories based on advancing development (I–IV). (D) Quantification of Sox2+ cells at each stage of placode morphogenesis (one-way ANOVA, n = 11, 7, 11, 13 placodes from 6, 4, 11, and 8 skins for stages I – IV, respectively). (E) Quantification of the median distance of Sox2+ cells to the nearest placode surface (one-way ANOVA, n = 11, 7, 11, 13 placodes from 6, 4, 11, and eight skins for stages I – IV, respectively) (F) Transmission electron micrographs of E14.5 wild-type skin dermal condensation (DC) and an interfollicular (IF) region. Note the convex nuclei and lack of space between the cells in the DC compared to the non-DC region. (G) Confocal optical sections (sagittal view) of advancing HF morphogenesis (stages I-IV); Sox2+ nuclei (red) are contrasted with Sox2- nuclei (blue); white outlines provide an example of cells compared. (H) Quantification of sphericity of Sox2+ and Sox2- nuclei; significance was assessed using Student’s T-test (nI = 92 and 162 (6 placodes, three skins), nII = 253 and 163 (6 placodes, two skins), nIII = 332 and 217 (6 placodes, two skins), nIV = 125 and 137 (8 placodes, three skins) DC and IF cells, respectively). A, anterior; P, posterior; SPD, sub-placodal dermis. Error bars represent standard deviation (SD). *p≤0.05; **p≤0.01; ***p≤0.001; ****p≤0.0001. Scale bar = 10 µm. See also Figure 1—video 1 and Figure 1—source data 1.

