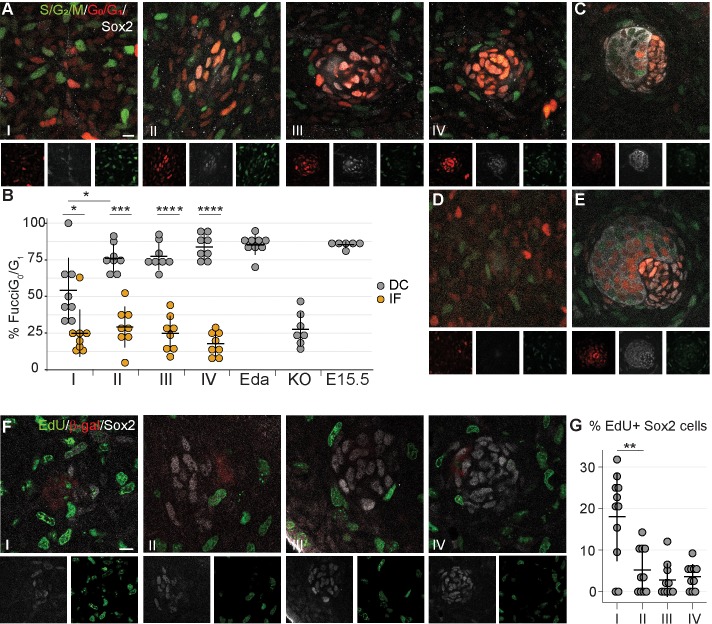
Figure 3. Dermal condensation cells exhibit cell cycle exit.
(A, C–E) Confocal microscopy optical planar sections of Fgf20+/-;Fucci (G1 red; S/G2/M green) skins at indicated stages of HF placode morphogenesis (I–IV) were labeled with antibodies against β-Gal (cytoplasmic white) and Sox2 (nuclear white). (A) The Sox2+ nuclei were scored as red, green, both, or neither and compared to the interfollicular Sox2- fibroblasts (n = eight placodes per stage from seven, four, five, and five skins in stages I, II, III, and IV, respectively). (B) Quantification of percent Sox2+ (DC) cells and Sox2- (IF) fibroblasts in G0/G1 phase during HF placode morphogenesis (I–IV), in E14.5 K14-Eda (Eda), in E14.5 Fgf20-/- (KO), and in E15.5 Fgf20+/- (E15.5), paired Student’s T-test. (C–E) Expression of Fucci transgenes in (C) E15.5 control DCs (n = nine placodes from four skins), (D) E14.5 Fgf20-/- dermis immediately adjacent to the placode (n = seven placodes from three skins), and (E) E14.5 K14-Eda (n = six placodes from two skins) DCs. (F) Confocal microscopy optical planar sections of Fgf20+/- skins at indicated stages of HF placode morphogenesis (I–IV). Embryos were subjected to 2 hr EdU pulse in utero prior to sacrifice. Skins were treated with Click-It detection to visualize EdU-positive cells (green) and immunolabeled with Sox2 (white) and β-gal (red, not shown). (G) Quantification of EdU-positive Sox2 DC cells (nI = 11 placodes from three skins, nII = 10 placodes from five skins, nIII = 10 placodes from five skins, nIV = 11 placodes from five skins). *, p≤0.05; ***, p≤0.001 ****, p≤0.0001. Error bars represent SD. Scale bar = 10 µm. See also Figure 3—source data 1.


