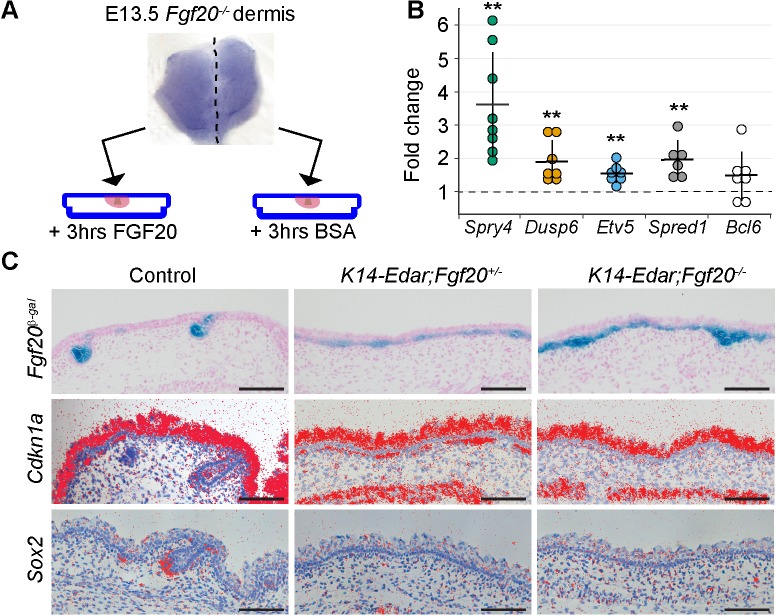
Figure 5. Fgf20 transcriptional targets in the dermis.
(A) Schematic of the experimental setup. E13.5 Fgf20-/- dermises were separated into halves along the dorsal midline, each half was cultured for 3 hr in the presence of either 1 µg/ml FGF20 or with 0.1% BSA vehicle control. RNA was extracted and processed for RNA sequencing. (B) qRT-PCR was carried out on replicate samples for Spry4 (n = 8), Dusp6 (n = 7), Etv5 (n = 7), Spred1 (n = 6), and Bcl6 (n = 7). Significance was assessed with one-sample T-test, **=p < 0.01. Error bars represent SD. (C) Skins from E15.5 Fgf20+/- (control), K14-Edar;Fgf20+/-, and K14-Edar;Fgf20-/- embryos (n = 6 embryos each) were assayed for β-galactosidase activity to assess the expression of the Fgf20β-Gal knock-in allele (top). Note the follicular localization of β-Gal activity in Fgf20+/- embryos, which is localized throughout the epidermis in K14-Edar;Fgf20+/-, and K14-Edar;Fgf20-/- embryos. Radioactive in situ hybridization was utilized to detect Cdkn1a (p21) (middle) and Sox2 (bottom) at E16.5. Note that Cdkn1a was restricted to the DC in the dermis in control embryos, but was localized throughout the upper dermis in K14-Edar embryos in an Fgf20-dependent manner. Cdkn1a was also strongly expressed in the differentiating epidermis and the panniculus carnosus muscle. See also Table 1, Figure 5—source data, and Figure 5—figure supplement 1.


