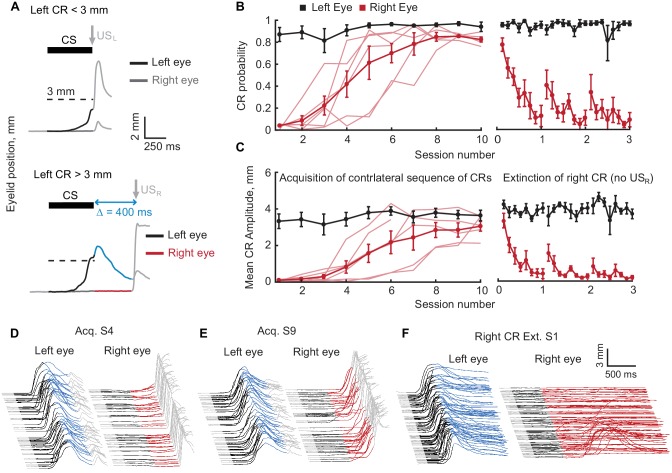
Figure 3. Acquisition and extinction of contralateral sequences of CRs.
(A) A schematic representation of the contralateral sequence training protocol. Top panel shows an example trial with left eye CR amplitude smaller than target 3 mm value (dotted line) and where USL is delivered to the left eye. The bottom panel shows a trial with left CR amplitude larger than 3 mm. In these instances, USL is omitted and USR is delivered to the right eye. Color-coding of left eyelid position is the same as in Figure 1. For right eyelid position CS duration is indicated by a dark grey color, the interval between CS offset and USR is shown in red. (B) CR probability as a function of session number. Left panel shows acquisition curves of right eye CR in contralateral sequence. Probability of left eye CR is shown in black, right eye CR – in red. Thin lines represent individual subjects, thick lines – group averages. Right panel shows data from three sessions of right eye CR extinction. Data in each session were broken down into eight equal portions to evaluate the time profile of extinction through the session. (C) Same as (B), but for average amplitude of CRs in ipsilateral sequence. (D–F) Examples of acquisition and extinction sessions of contralateral sequence of CRs. For each session left eye responses are shown on the left, right eye responses – on the right. In all cases only trials with left eye CR amplitude larger than 3 mm are shown.


