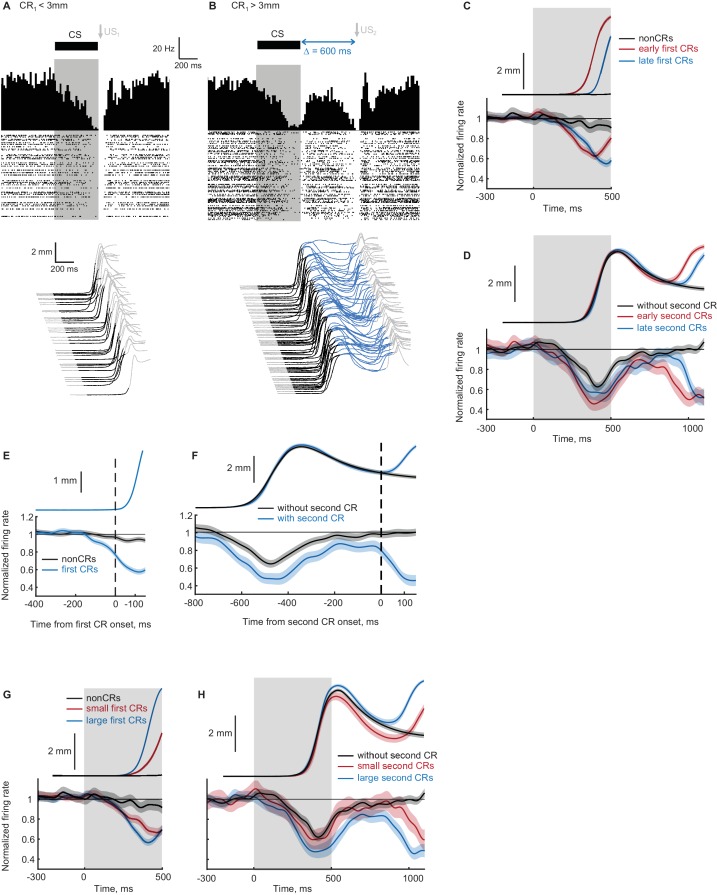
Figure 8. Recordings from eyelid Purkinje cells during ipsilateral sequence sessions.
(A–B) Example eyelid PC recording during an ipsilateral sequence training session. (A) Behavioral responses on trials with first CR amplitude smaller than 3 mm are shown at the bottom, corresponding PSTH and a raster plot of eyelid PC simple spikes are shown at the top. CS duration is indicated by a black color in behavioral waterfall plots and by a grey shaded area in the raster plot. (B) The same format as in panel (A), showing data on trials with first CR amplitude larger than 3 mm and consequently US2 delivery. (C) Average eyelid response profiles on trials sorted by the onset time of first CR are shown on top, corresponding average eyelid PCs firing rate normalized by the baseline level is shown at the bottom. Non-CR trials are shown in black, trials with early and late CR onset times are shown in red and blue respectively. Behavioral responses and eyelid PCs activity are truncated at US1 onset, shaded regions represent 95% confidence intervals. (D) Similar to (C), but for trials with first CR present and sorted by the onset times of second CRs. Color-coding is similar to (C), behavioral responses and eyelid PCs activity are truncated at US2 onset. (E) Eyelid PCs activity aligned by first CR onset times (vertical black dotted line) is shown at the bottom; aligned CRs profile is shown on top. Eyelid PCs activity on CR trials is shown in blue color, on non-CR trials – in black. (F) Behavioral responses and eyelid PCs activity aligned to the onset time of second CR (vertical black dotted line). First CRs are present in all trials, results from trials with second CRs present are shown in blue color, without second CRs – in black. (G) Average eyelid response profiles on trials sorted by first CR amplitude are shown on top, corresponding average eyelid PCs firing rate is shown at the bottom. Non-CR trials are shown in black, trials with small and large first CR amplitudes are shown in red and blue respectively. (H) Similar to (G), but for trials with first CR present and sorted by the second CR amplitude.

