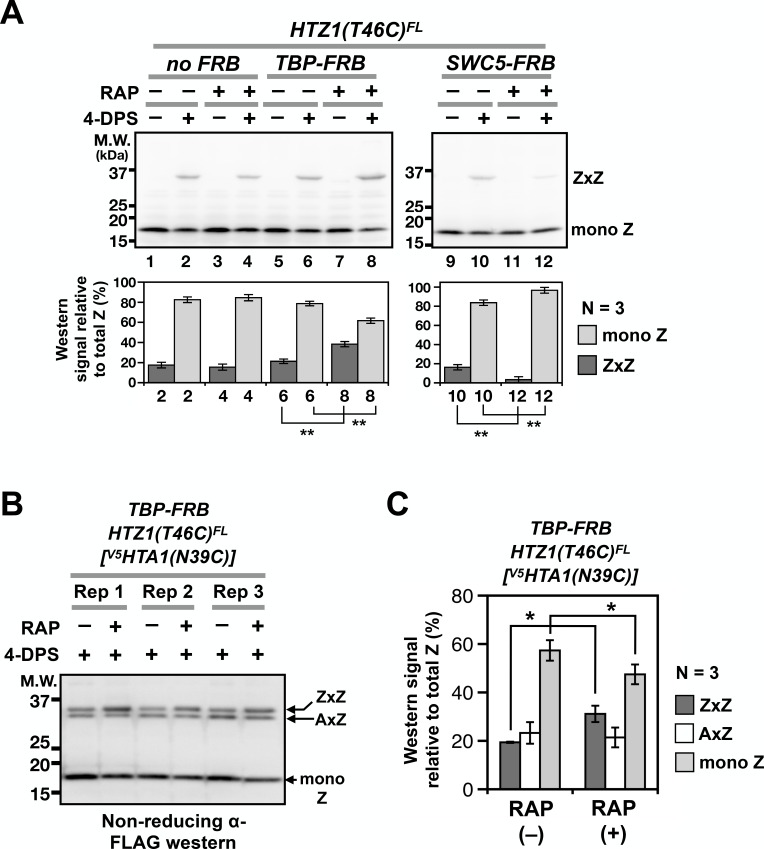
Figure 5. Probing H2A.Z dynamics using VivosX.
(A) HTZ1(T46C)FL strains containing the TBP-FRB or SWC5-FRB alleles or the corresponding wild-type alleles (no FRB) in the Anchor-away genetic background (W303 MAT a tor1-1 fpr1 RPL13A-2xFKBP12) (Haruki et al., 2008) were incubated with rapamycin (+RAP) or without (i.e. DMSO, –RAP) for 1 hr before each culture was divided into halves, where one half was oxidized with 4-DPS (for 20 min) and the other without. Fixation, protein extraction, and immunoblotting analysis were conducted as described for Figure 1D. Bottom panels: Quantification of the ZxZ bands and the mono Z bands was performed as described in Figure 1D. (B) VivosX was performed using HTZ1(T46C)FL TBP-FRB yeast transformed with the [V5HTA1(N39C)-HTB1] plasmid. Rep: biological replicates. (C) Quantification of (B). The immunoblot signals of ZxZ, AxZ, and mono Z were normalized to total H2A.Z. Bars and error bars represent the means and standard deviations of three biological replicates. One asterisk (*) indicates p≤0.05 and two (**) indicates p≤0.01 of t-tests.

