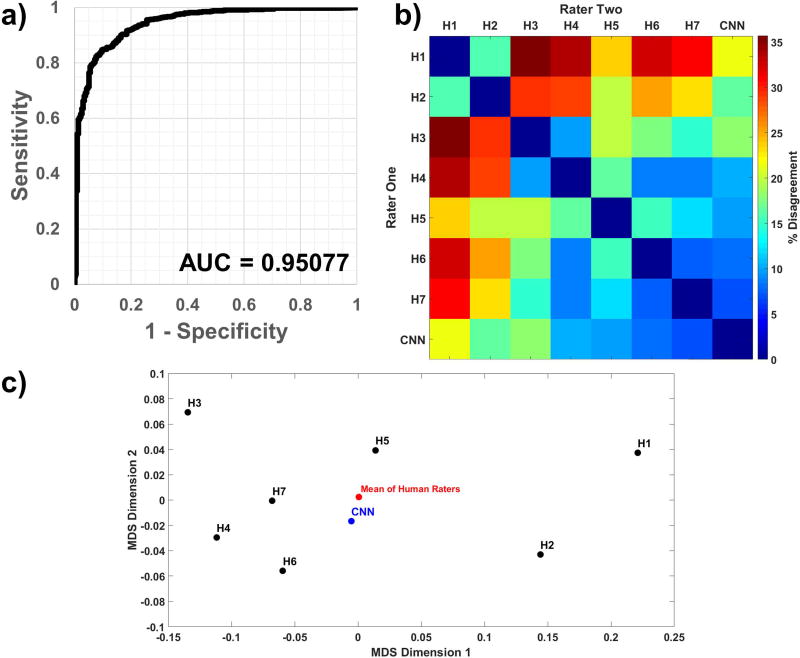
Figure 4.
(a) An unused test data set (n=850 spectra), with class proportions matching that of the full data set, was run through the CNN; comparing the output probabilities to ground truth resulted in a receiver-operator characteristic curve with an AUC of 0.951. The (b) dissimilarity heatmap and (c) a multidimensional scaling plot comparing sets of pairwise inter-rater agreement show that the CNN’s similarity with any given human rater is within the ranges of inter-human rater similarity.

