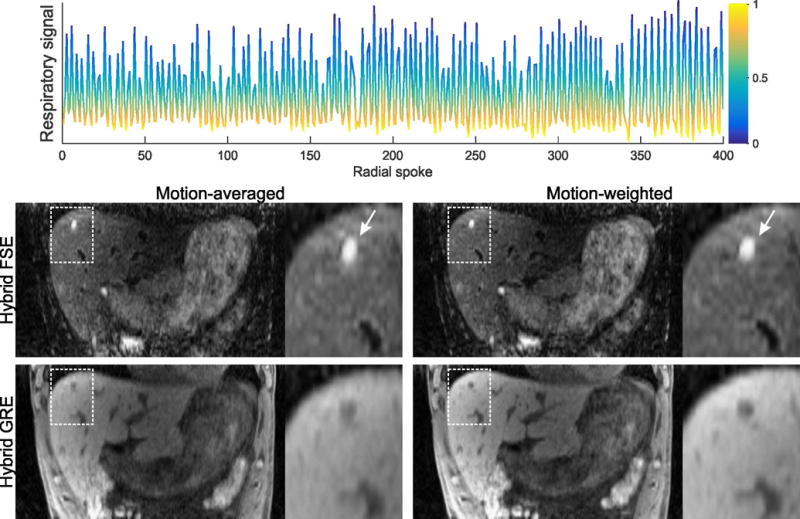
Fig. 7.

Respiratory curve extracted from the GRE k-space data with the algorithm described in the theory section. This signal was used to assign weights between 0 (end-inspiration) and 1 (end-expiration), as indicated with different colors. When motion-averaged reconstruction is performed (left column), blurring occurs due to respiratory motion and results in smudging of the cyst in superior-inferior direction. By using motion-weighted reconstruction, the blurring is reduced and the cyst appears with improved sharpness.
