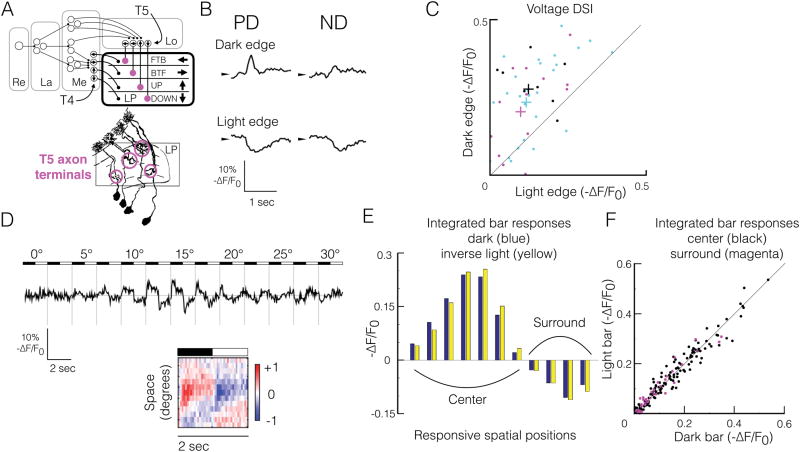
Figure 1. T5 voltage responses to moving and stationary local stimuli are consistent with a direction-selective linear system.
(A) Top, functional organization of the fly EMD. T4 and T5 project to the lobula plate (LP), where their axon terminals are arranged in layers according to their preferred direction (PD, arrows). Retina (Re), lamina (La), medulla (Me), lobula (Lo), lobula plate (LP). Bottom, golgi stain representation of T5 morphology (adapted, without magenta circles, from (Fischbach and Dittrich, 1989); axon terminals are highlighted with magenta circles.
(B) Mean ASAP2f fluorescence response timecourses (-ΔF/F0) of a single T5 axon terminal to dark and light edges moving at 90°/s in PD and ND. ASAP2f decreases fluorescence with depolarization, so by convention, fluorescence timecourses are inverted.
(C) Direction selectivity indices (DSI) derived from ASAP2f responses to moving light vs dark edges. DSI defined as (PD-ND)/(PD+ND). Each point represents a single T5 cell responding to edges moving at either 30°/s (black, n = 9, from 5 flies), 60°/s (magenta, n = 15, from 7 flies), or 90°/s (cyan, n = 33, from 17 flies). Colored pluses indicate mean for each velocity.
(D) Top, ASAP2f fluorescence response timecourses of a single axon terminal (-ΔF/F0) to individual 2.5°-wide bars, in the preferred orientation, on a grey background, alternating between dark and light contrast at 0.5 Hz, at 13 adjacent spatial positions, covering a 30° region of visual space. For each spatial position, the mean response to a single cycle of the stimulus is shown. Bottom, spacetime plot (XT plot) of responses depicted above. Each row represents the normalized mean response to one stimulus cycle (dark to light) for each spatial position. Red indicates depolarization (positive -ΔF/F0), blue indicates hyperpolarization (negative -ΔF/F0).
(E) Time-integrated dark bar voltage responses (blue) and inverse light bar voltage responses from panel D (yellow) at each spatial position eliciting responses.
(F) Time-integrated inverse light bar responses vs dark bar responses for all single T5 cells responding to stationary flashing bars at 0.5 Hz. Black dots correspond to single-cell responses from the receptive field center (depolarized to dark bars, hyperpolarized to light bars), integrated across the entire center; magenta dots correspond to responses from the receptive field surround (hyperpolarized to dark bars, depolarized to light bars), integrated across the entire surround. n=18 cells from 9 flies.

