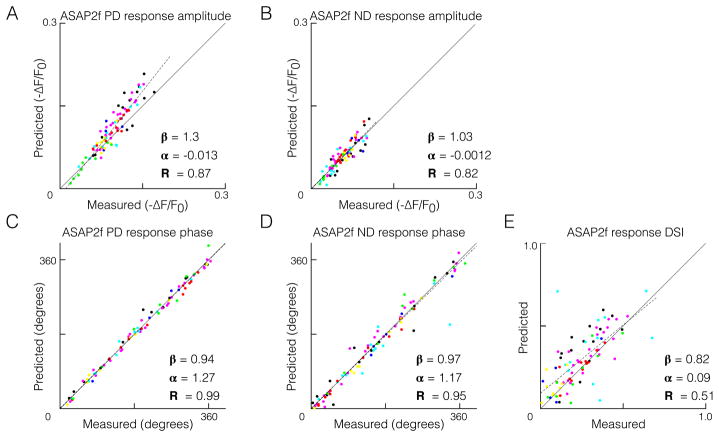
Figure 4. A linear model quantitatively predicts direction-selective responses in T5.
(A–E) Comparison of measured responses and linear predictions of responses to moving sinusoidal gratings, each having a unique spatial and temporal frequency combination, and each represented by a different color (same set of cells and same color coding as in Figure 2C, S2C-F, S5, and S6). ASAP2f response amplitude was quantified as the 95th percentile minus the 5th percentile, and response phase was quantified as the phase of the component signal at the frequency of the stimulus (F1). Dotted lines represent least-squares fits to the data, with slope, intercept, and R-squared values indicated. See also Figure S4.

