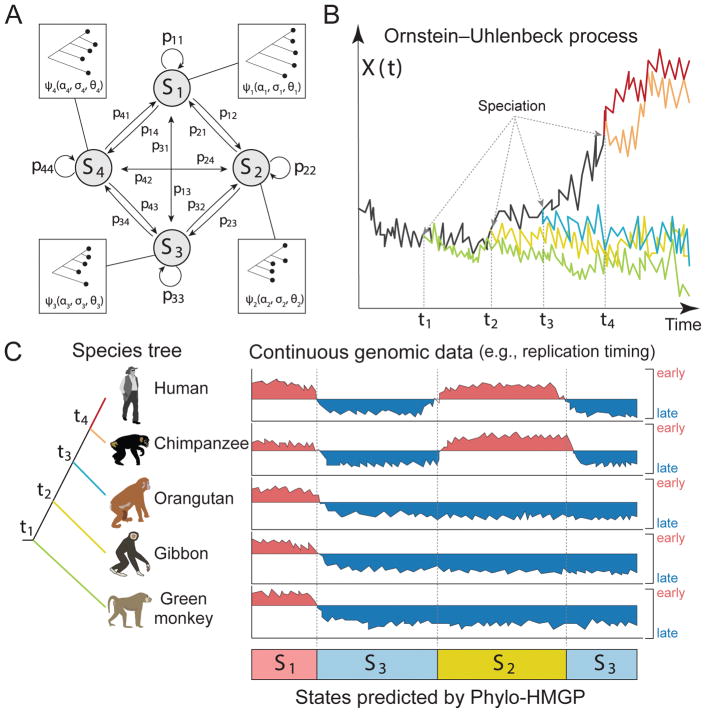
Figure 1. Overview of the Phylo-HMGP model.
(A) Example of the state space and state transition probabilities of the Phylo-HMGP model associated with the continuous genomic data in (C). Si represents a hidden state. Each hidden state is determined by a phylogenetic model ψi, which is parameterized by the selection strengths αi, Brownian motion intensities σi, and the optimal values θi of ancestor species and observed species on the corresponding phylogenetic tree. αi, σi, and θi are all vectors. (B) Illustration of the Ornstein-Uhlenbeck (OU) processes along the species tree specified in (C). X(t) represents the continuous trait at time t. The trajectories of different colors along time correspond to the evolution of the continuous trait in different lineages specified by the corresponding colors in (C), respectively. The time points t1, t2, t3, and t4 represent the speciation time points, which correspond to the speciation events shown in (C). The observations of the five species also represent an example of state S2 in (C). (C) Simplified representation of input and output of the Phylo-HMGP model. The five tracks of continuous signals represent the observations from five species. Si represents the underlying hidden states. Specifically, the example is the replication timing data, where ‘early’ and ‘late’ represent the early and late stages of replication timing, respectively. The species tree alongside the continuous data tracks shows the evolutionary relationships among the five species in this study. See also Figure S2, Figure S8, and Figure S9.

