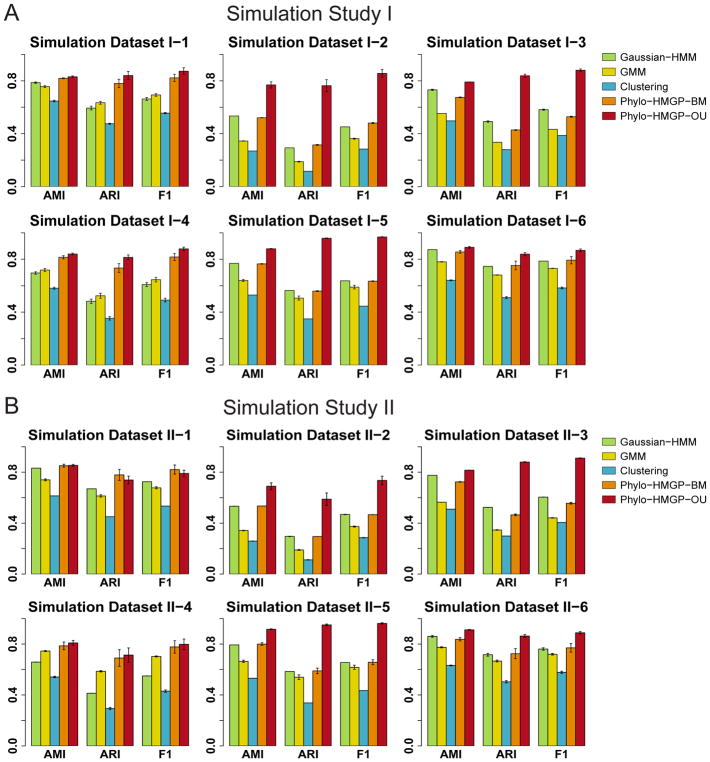
Figure 2. Evaluation using simulated datasets.
(A) Evaluation of Gaussian-HMM, GMM, K-means Clustering, Phylo-HMGP-BM, and Phylo-HMGP-OU on six simulation datasets in Simulation Study I in terms of AMI (Adjusted Mutual Information), ARI (Adjusted Rand Index), and F1 score. (B) Evaluation of Gaussian-HMM, GMM, K-means Clustering, Phylo-HMGP-BM, and Phylo-HMGP-OU on six simulation datasets in Simulation Study II in terms of AMI, ARI, and F1 score. In both (A) and (B), the standard error of the results of 10 repeated runs for each method is also shown as the error bar. See also Table S1, Table S2, and Figure S1.

