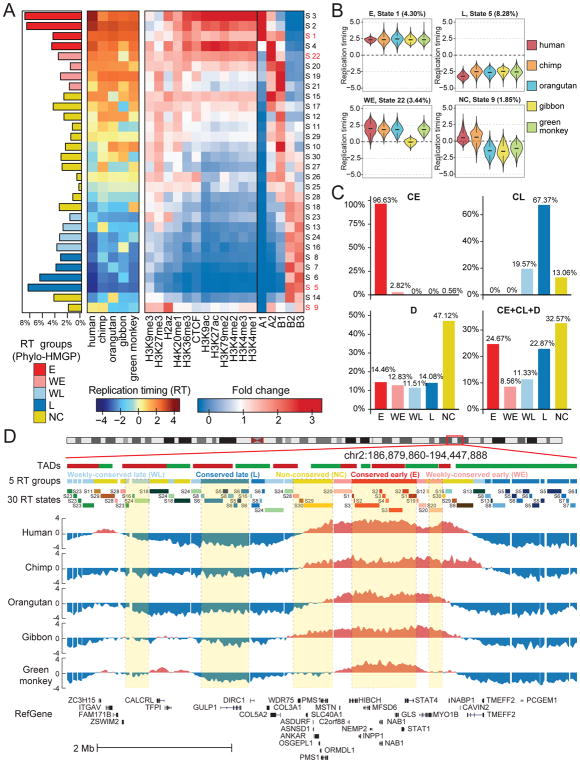
Figure 3. RT evolution patterns identified by Phylo-HMGP.
(A) Panel 1 (leftmost): Proportions of the 30 RT states on the entire genome. The RT states are categorized into 5 groups: conserved early (E), weakly conserved early (WE), weakly conserved late (WL), conserved late (L), and other stages (NC), respectively. Panel 2: Patterns of the 30 states. Each row of the matrix corresponds to the state at the same row in Panel 1, and columns are species. Each entry represents the median of the RT signals of the corresponding species in the associated state. Panel 3: Enrichment of different types of histone marks and CTCF binding site (higher fold change represents higher enrichment). Panel 4: Enrichment of subcompartment A1, A2, B1, B2, and B3. (B) Four examples of RT signal distributions in states with different patterns (State 1: E; State 5: L; State 22: WE; State 9: NC with human-chimpanzee specific early RT). (C) Comparison of predicted RT patterns with the constitutively early/late RT regions identified across cell types. (D) Examples of different RT states and RT groups in five species predicted by Phylo-HMGP. TADs called by the Directionality Index method are shown at the top. See also Figure S2, Figure S3, Figure S4, Figure S5, Figure S6, and Figure S7.

