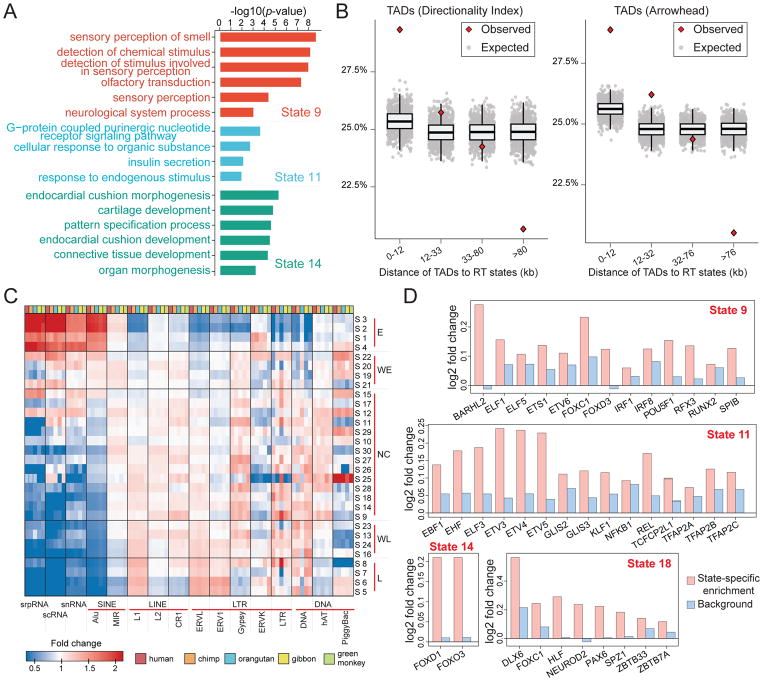
Figure 4. Comparisons between the RT evolution patterns and other genomic features.
(A) Example gene ontology (GO) analysis results of state 9, state 11, and state 14. (B) Percentages of the distances between TAD boundaries and boundaries of predicted states in different intervals. The expected distances are calculated based on randomly shuffled TADs. Two types of TADs from different methods are used, namely TADs called by the Directionality Index method and TADs called by Arrowhead. (C) Transposable element enrichment in different RT states. (D) Motif enrichment in different lineage-specific RT states. State 9: human-chimpanzee specific early RT. State 11: human-chimpanzee-orangutan specific early RT. State 14: orangutan specific early RT. State 18: green monkey specific early RT. See also Figure S2, Table S3, and Table S4. The GO analysis results of other lineage-specific RT states are included in Table S4.

