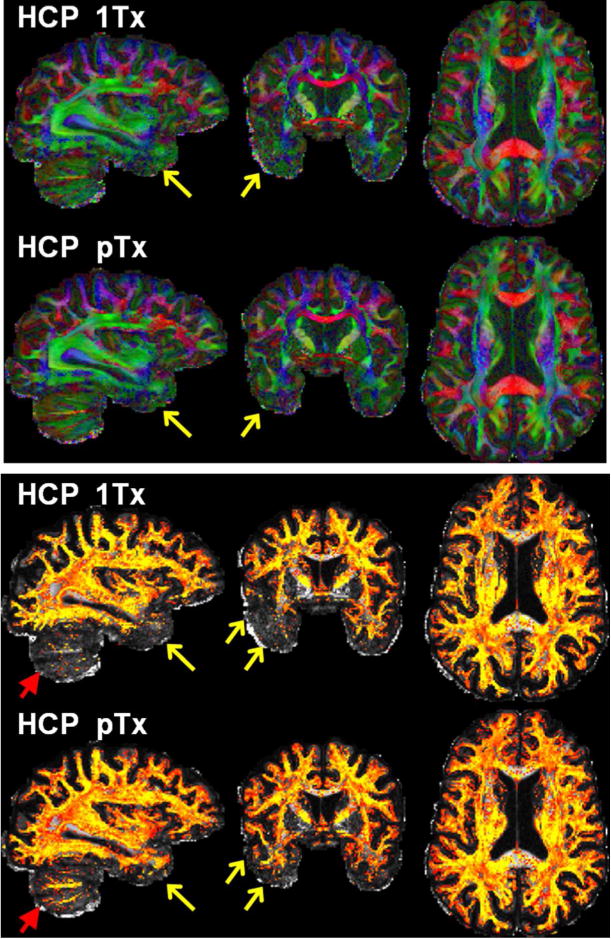
Fig. 5.

Comparing HCP 7T dMRI protocol (HCP 1Tx) with HCP pTx protocol. Data are shown for one subject. Shown are color fractional anisotropy (FA) maps (top panel) and volume fraction maps for second fiber orientations (bottom panel). The color FA is FA (in the range of [0 1]) with the color representing the orientation of the principal fiber (red: left-right; green: anterior-posterior; blue: inferior-superior). The volume fraction map is shown in a colorscale of [0.05 0.2] (with yellow being high and red being low in volume fraction), overlaid on the respective FA map (in a grayscale of [0 1]). Both dMRI datasets were acquired with 1.05 mm isotropic resolutions, MB2, in-plane acceleration factor=3, and TE=71 ms. The TR for pTx acquisition was slightly longer (7400 vs 7000 ms). Both acquisitions utilized the same q-space sampling scheme (double shells, b-value=1000/2000 s/mm2), corresponding to 143 unique image volumes, each acquired twice with anterior-posterior (AP) and PA phase encode directions. Total scan time was kept constant for both datasets (i.e., 40 minutes divided into 4 segments of 10 minutes each). Note that the use of pTx improved fiber orientation estimation performances not only in lower temporal lobe (as indicated by yellow arrows) but also in cerebellum (as highlighted by red arrows).
