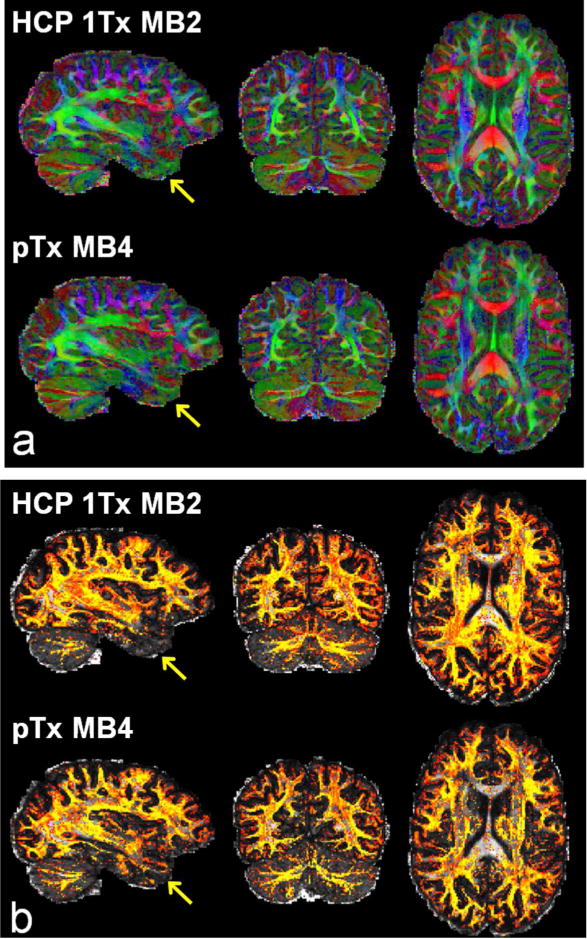
Fig. 9.

Comparing HCP 7T dMRI protocol with the pTx MB4 protocol in another subject. (a) Color fractional anisotropy (FA) maps. (b) Volume fraction maps for second fiber orientations. The color FA is FA (in the range of [0 1]) with the color representing the orientation of the principal fiber (red: left-right; green: anterior-posterior; blue: inferior-superior). The volume fraction map is shown in a colorscale of [0.05 0.2] (with yellow being high and red being low in volume fraction), overlaid on the respective FA map (in a grayscale of [0 1]). Both dMRI datasets were acquired with 1.05 mm isotropic resolutions, in-plane acceleration factor=3, TE=71 ms, and double-shell q-space sampling (b-value=1000/2000 s/mm2). Total number of image volumes was kept constant for both acquisitions (i.e., 286 images volumes were acquired as in the HCP 7T protocol). Because of use of a ~50% shorter TR (3701 vs 7400 ms for MB2), the MB4 acquisition would reduce the scan time by half (20 vs 40 minutes for MB2). Note that the use of pTx with MB4 to achieve the same data quantity in half scan time gave rise to better performances for estimation of multiple fiber orientations in lower brain regions especially the lower temporal lobe (as indicated by yellow arrows).
